Fig. 10.
Download original image
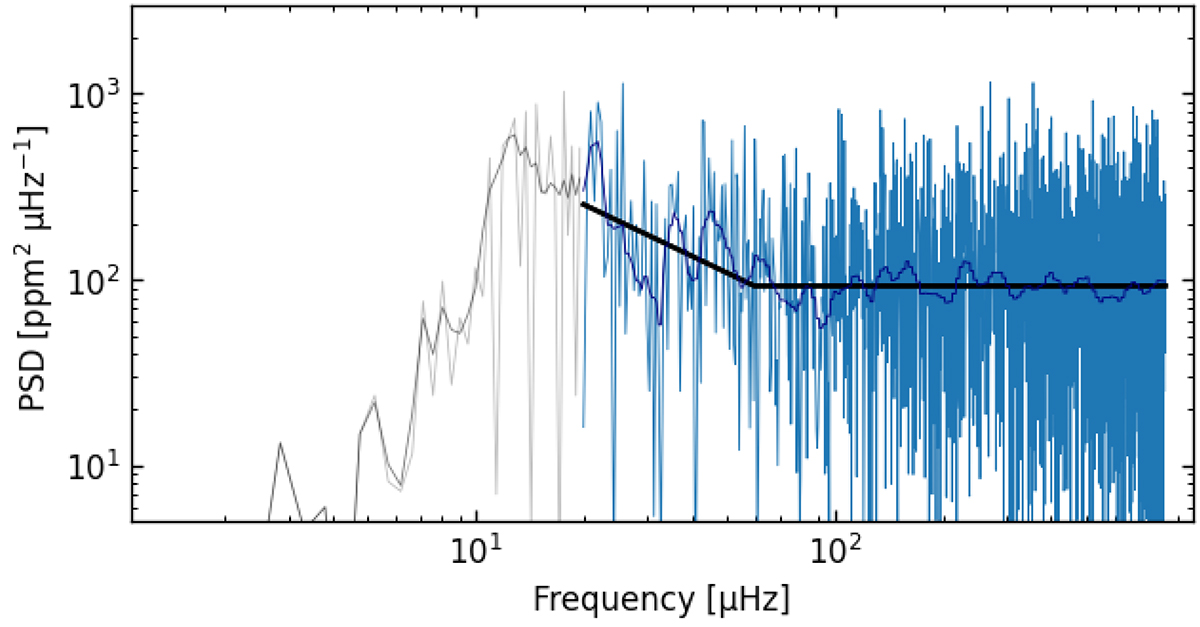
PSD of the Sector 27 data of the red giant TIC 374859063, computed up to the Nyquist frequency. The input light curve was processed following the procedure described in Sect. 3. The blue portion of the PSD was used in the subsequent analysis, where a piecewise linear fit in the log-log space was applied (black line). The gray part of the PSD is influenced by the SG filtering and is therefore excluded.
Current usage metrics show cumulative count of Article Views (full-text article views including HTML views, PDF and ePub downloads, according to the available data) and Abstracts Views on Vision4Press platform.
Data correspond to usage on the plateform after 2015. The current usage metrics is available 48-96 hours after online publication and is updated daily on week days.
Initial download of the metrics may take a while.