Fig. 1.
Download original image
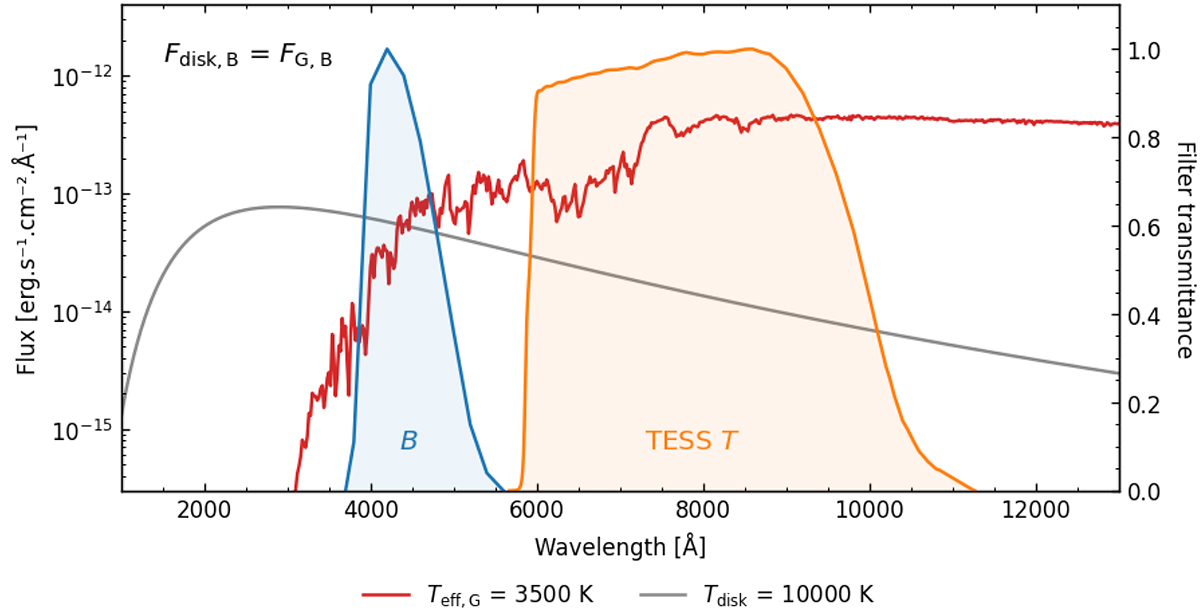
Visual representation of one of the scenarios discussed in Sect. 2 where the flux of the red giant (depicted by the red line) and the accretion disk (represented by the black-body model in gray) are equal in the Johnson B filter. The response curves of the Johnson B and TESS T filters are overplotted in blue and orange, respectively.
Current usage metrics show cumulative count of Article Views (full-text article views including HTML views, PDF and ePub downloads, according to the available data) and Abstracts Views on Vision4Press platform.
Data correspond to usage on the plateform after 2015. The current usage metrics is available 48-96 hours after online publication and is updated daily on week days.
Initial download of the metrics may take a while.