| Issue |
A&A
Volume 683, March 2024
|
|
|---|---|---|
| Article Number | A136 | |
| Number of page(s) | 7 | |
| Section | Galactic structure, stellar clusters and populations | |
| DOI | https://doi.org/10.1051/0004-6361/202348106 | |
| Published online | 15 March 2024 | |
Metal-poor stars with disc-like orbits
Possible traces of the Galactic disc at very early epochs
1
INAF – Osservatorio di Astrofisica e Scienza dello Spazio di Bologna, Via Piero Gobetti 93/3, 40129 Bologna, Italy
e-mail: This email address is being protected from spambots. You need JavaScript enabled to view it.
2
Institute of Astronomy, University of Cambridge, Madingley Road, Cambridge CB3 0HA, UK
3
Dipartimento di Fisica e Astronomia, Università degli Studi di Bologna, Via Piero Gobetti 93/2, 40129 Bologna, Italy
Received:
28
September
2023
Accepted:
1
December
2023
Abstract
We used photometric metallicity estimates for about 700 000 stars in the surroundings of the Sun, with very accurate distances and 3D motions measures from Gaia DR3, to explore the properties of the metal-poor (−2.0 < [Fe/H] ≤ −1.5; MP) and very metal-poor ([Fe/H] ≤ −2.0; VMP) stars with disc kinematics in the sample. We confirm the presence of a significant fraction of MP and VMP stars with disc-like orbits and that prograde orbits are prevalent among them, with a prograde-to-retrograde ratio of P/R ∼ 3. We highlight a statistically significant difference in the distribution of the Z component of the angular momentum (LZ) and orbital eccentricity between prograde and retrograde disc-like MP stars for the first time. The same kind of difference is found in the VMP sub-sample, albeit at a much lower level of statistical significance, likely due to the small sample size. We show that prograde disc-like MP and VMP stars display an additional component of the |LZ| distribution with respect to their retrograde counterpart. This component is at higher |LZ| with respect to the main peak of the distribution, possibly hinting at the presence of a pristine prograde disc in the Milky Way. This hypothesis is supported by the results of the analysis of a large sub-sample dominated by stars born in situ. In this case, the prevalence of prograde stars is also clearly detected at [Fe/H] ≤ −1.5, and their |LZ| distribution is more skewed toward high |LZ| values than their retrograde counterpart. This suggests that the seed of what will eventually evolve into the main disc components of the Milky Way may have already been in place in the earliest phases of the Galaxy assembly.
Key words: catalogs / stars: abundances / Galaxy: disk / Galaxy: formation / Galaxy: structure
© The Authors 2024
 Open Access article, published by EDP Sciences, under the terms of the Creative Commons Attribution License (https://creativecommons.org/licenses/by/4.0), which permits unrestricted use, distribution, and reproduction in any medium, provided the original work is properly cited.
This article is published in open access under the Subscribe to Open model. This email address is being protected from spambots. You need JavaScript enabled to view it. to support open access publication.
1. Introduction
Metal-deficient stars are expected to bear memory of the earliest phases of Galaxy evolution (see, e.g. Miranda et al. 2016; El-Badry et al. 2018). Once believed to live only in the pressure-supported Galactic spheroid, it is now generally recognised that stars with [Fe/H] < −1.0 as well as with [Fe/H] < −2.0 also exist in significant numbers on disc-like orbits, either as the metal-weak component of the thick disc (Ruchti et al. 2010; Beers et al. 2014; Li & Zhao 2017; Carollo et al. 2019, and references therein) or as separate components, possibly of accretion origin (see, e.g. Carter et al. 2021; Sotillo-Ramos et al. 2023, and references therein).
The interest on these ancient disc components was recently revived by the discovery of extremely metal-poor stars ([Fe/H] ≤ −2.5/−3.0) with disc-like kinematics and a preference for prograde over retrograde orbits (Sestito et al. 2019, 2020; Cordoni et al. 2021; Carter et al. 2021; Carollo et al. 2023). The comparison with simulations of Milky Way (MW) analogues suggests that the majority of these stars should originate from accretion events on nearly planar orbits, but in situ formation may also play a significant role, depending on the specific evolutionary path of each given galaxy and on the considered metallicity range, as well as on the specific set of simulations considered (Sestito et al. 2021; Carter et al. 2021; Santistevan et al. 2021; Carollo et al. 2023; Sotillo-Ramos et al. 2023; Pinna et al. 2024). For instance, according to Santistevan et al. (2021) and Sestito et al. (2021), the contribution of the in situ component is minor or negligible, respectively. In any case, these stars can provide a precious view on the earliest phases of the formation of the MW disc (Belokurov & Kravtsov 2022; Conroy et al. 2022; Rix et al. 2022; Chandra et al. 2023; Semenov et al. 2024, 2023).
In the present contribution, we attempt to have a new insight into the properties of the metal-poor stars with disc-like orbits by using the recently released sample by Bellazzini et al. (2023, hereafter B23), that provides photometric metallicity with typical accuracy of ≃0.1 dex and typical precision ≲0.2 dex for about 700 000 red giant branch stars within a few kiloparsec of the Sun1, in the −3.0 ≲ [Fe/H] ≲ +0.8 range. While significantly smaller than many other samples providing photometric metallicities for MW stars (see, e.g., Yang et al. 2022; Xu et al. 2022; Andrae et al. 2023; Martin et al. 2023), the B23 sample is carefully selected, homogeneous, and, most importantly for the present application, limited to stars with excellent astrometry from Gaia DR3 (errors on parallax lower than 10%; Gaia Collaboration 2023). Moreover, the sample is much larger than those previously used to investigate the metal-poor disc, including the recent thorough analysis of the disc evolution by Belokurov & Kravtsov (2022). Here, we considered the 685 087 stars having valid radial velocity (RV) measures from Gaia DR3 (Katz et al. 2023), 95% of these stars having RV uncertainties ≤5 km s−1.
In this work, we used the [Fe/H] values obtained by B23 using the Calamida et al. (2007) [Fe/H] = f(m0, (v − y)0) relation, re-calibrated on APOGEE DR 17 (Abdurro’uf et al. 2022) spectroscopic iron abundances. For more details on the sample properties, we refer the interested reader to B23, where it was used to derive the metallicity distribution functions (MDF) of several substructures identified by Dodd et al. (2023). However, it may be useful to recall here that we adopted the same estimates of the integral of motions and orbital parameters of stars computed by B23 with AGAMA (Vasiliev 2019), adopting the Galactic potential by McMillan (2017).
2. The kinematics of metal-poor disc-like stars
The metal-poor disc-like component of the local MW population emerges clearly from the B23 data in different ways. Here we display it in a plane of the space parameters that seems especially informative to us, that is the one relating the vertical component of the orbital angular momentum LZ (in km s−1 kpc, with positive values indicating prograde motion, i.e. rotation around the Galactic centre in the same direction as the Sun) to the metallicity [Fe/H]2, with stars colour-coded according their orbital eccentricity ϵ3.
In Fig. 1, we show the distribution of stars in this plane for three slices of the sample in Zmax, which is the maximum absolute height over the Galactic plane reached by a star orbit. This implies that, for example, undisturbed stars with Zmax < 1.0 kpc are permanently confined within this distance from the plane, modulo the uncertainties in the integration of the orbit. The upper panel of Fig. 1 shows exactly this Zmax < 1.0 kpc subset.
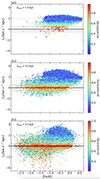 |
Fig. 1. Metallicity of stars in our sample versus component of angular momentum perpendicular to disc plane for three different slices in the maximum absolute height over the Galactic plane reached by the star orbit. Points are colour-coded according to the orbital eccentricity. The thin black lines are at LZ = ±500 km s−1 kpc, while the grey line marks the Z angular momentum of the Sun: LZ = 1909 km s−1 kpc in the adopted reference frame. The sub-samples plotted in the various panels contain 185 178, 580 551, and 104 530 stars, respectively, from top to bottom. |
Given the main selection of the B23 sample (in Galactic latitude, |b|> 20.0°), these very-low-Zmax stars are confined within a distance range of ≃2.5 kpc of the Sun. The B23 sample is dominated by thick disc stars, but in this slice the contamination by the more metal-rich and colder thin disc is significant. Here stars from both discs are confined in the narrow (i.e. dynamically cold) strip of very low eccentricity and are clustered around LZ = LZ⊙, where LZ⊙ = 1909 km s−1 kpc in our reference frame. The contribution of thin disc stars (very low eccentricity and low dispersion about LZ⊙) is clearly prevalent, especially for [Fe/H] ≳ −0.5, where the dispersion in LZ decreases with increasing metallicity. Stars with small net rotation or retrograde are rare4.
In the middle panel the planar slice is extended to Zmax < 3.0 kpc. The bulk of the disc population displays a wider distribution in LZ due to a larger prevalence of thick disc stars. The stars with LZ > LZ⊙ virtually disappear for [Fe/H] < −1.4 (in all three Zmax slices shown in Fig. 1), in correspondence to a sharp drop in the MDF of the bulk of thick disc stars (see Ivezić et al. 2008). The retrograde side of the panel begins to be populated over a wide range of metallicity. A narrow stripe of high-eccentricity stars appears around LZ = 0.0 km s−1 kpc. These stars, which are present in different amounts in all the panels of Fig. 1, should be mostly associated with the Gaia-Enceladus/Sausage (GES) remnant (Helmi et al. 2018; Belokurov et al. 2018) for [Fe/H] ≤ −0.5, while in the most metal-rich regime there is likely a significant contribution from heated disc stars, that is, the so called Splash population (Belokurov et al. 2020). For [Fe/H] < −1.4 a population of moderate-eccentricity stars with slower net rotation than the Sun (in both the prograde and retrograde directions) extends to the metal-poor limit of our sample: these are the metal-poor disc-like stars that will be the subject of the following sections. The prevalence of prograde stars over their retrograde counterparts in this regime is already evident from this panel. The prograde-to-retrograde ratio for stars with Zmax < 3.0 kpc and [Fe/H] < −1.4 is P/R = 2.58 ± 0.13.
Finally, in the lower panel (Zmax > 3.0 kpc) the contamination from the thin disc disappears, and the bulk of the thick disc population clearly stands out in the −1.4 ≲ [Fe/H] ≲ 0.0 range, while the high-eccentricity, very low rotation component reaches its maximum. In general, stars with [Fe/H] ≲ −1.0 show a significantly more dispersed distribution of LZ with respect to the Zmax < 3.0 kpc slice, as expected from a halo population. In this metallicity range, the prograde and retrograde sides of the LZ distribution are roughly symmetric, except for a sparse LZ ≲ −2000 km s−1 kpc population that includes stars from highly retrograde substructures such as, e.g., Sequoia and Thamnos (see Myeong et al. 2019; Koppelman et al. 2019b, and B23).
Incidentally, we draw the reader’s attention to the few tens of [Fe/H] ≤ −2.0 moderate eccentricity stars clustered around the LZ = LZ⊙ line. These stars are also remarkably confined in terms of total energy, most of them, in particular those with ϵ ≲ 0.5, being enclosed within −1.6 × 10⁵ km2 s2 ≲ E ≲ −1.3 × 10⁵ km2 s2; hence, they may be part of an unknown substructure5. This group of highly prograde VMP stars seems different from the other known prograde substructures such as Aleph (Naidu et al. 2020) and Nyx (Necib et al. 2020), which are much more metal-rich, LMS-1/Wukong (Malhan et al. 2021; Naidu et al. 2020), which has a much lower mean LZ, and Icarus, whose typical stars have orbits confined below Zmax = 3.0 (⟨Zmax⟩ = 0.48 ± 0.59 kpc, Re Fiorentin et al. 2021). Some of the streams identified by Ibata et al. (2019, 2021) are similarly prograde and metal-poor (e.g. Svöl or Fjörm, Martin et al. 2022), but they are all very narrow and coherent structures, while the group identified here does not show any particular alignment in the sky.
Based on the middle panel of Fig. 1, we define our sample of disc-like metal-poor stars as those with (a) [Fe/H] ≤ −1.5, that is, beyond the metal-poor limit of the bulk of the thick disc population; (b) |LZ > 500| km s−1 kpc, that is, showing significant prograde or retrograde rotation, following Carollo et al. (2019); and (c) Zmax < 3.0 kpc, that is, with orbits confined in the proximity of the Galactic plane, as done by Sestito et al. (2020). This way, we selected 1027 stars, 772 on prograde orbits and 255 on retrograde orbits, confirming the asymmetry already discussed by several authors (Sestito et al. 2020; Carter et al. 2021; Carollo et al. 2023; Sotillo-Ramos et al. 2023). The prograde-to-retrograde ratio is P/R = 3.03 ± 0.22, assuming Poisson noise, within the range found in simulations of MW-analogues (Sestito et al. 2021; Santistevan et al. 2021; Sotillo-Ramos et al. 2023). For example, Santistevan et al. (2021) found that the P/R ratio (in mass) in the 12 simulated MW analogues they analysed (from the FIRE suite, Hopkins et al. 2018) ranges from ≃1 to ≃10, with a median of P/R ≃ 2, nearly constant for [Fe/H] < −1.5.
We further split our sample into metal-poor (MP, −2.0 < [Fe/H] ≤ −1.5) and very metal-poor (VMP, [Fe/H] ≤ −2.0) subsamples containing 834 and 193 stars, respectively. The prograde-to-retrograde ratio is P/R = 3.13 ± 0.25 in the MP sub-sample and P/R = 2.64 ± 0.43 in the VMP one; that is compatible with no difference, within the uncertainties.
2.1. Prograde versus retrograde comparison
We would like to know if the asymmetry between the prograde and retrograde metal-poor, disc-like populations is just a matter of numbers of stars or if it involves other properties. To investigate this issue, in Fig. 2 we compare the distribution of |LZ| and orbital eccentricity of the prograde and retrograde stars on disc-like orbits, as defined above, for the MP (left panels) and VMP (right panels) subsamples separately.
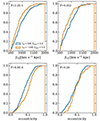 |
Fig. 2. Comparison of cumulative distributions of |LZ| and orbital eccentricity for prograde (blue) and retrograde (orange) sub-samples of the stars with |LZ|> 500 km s−1 kpc and Zmax < 3.0 kpc. The comparisons are performed separately for MP (834 stars, left column of panels) and VMP stars (193 stars, right column of panels). In the upper left corner of each panel, we report the probability that the prograde and retrograde samples are drawn from the same parent distribution in the considered quantity, according to a Kolmogorov–Smirnov test. |
The prograde MP population is remarkably more skewed towards high |LZ| (strong planar rotation) and low eccentricity than its retrograde counterpart. The statistical significance of the detected differences is very high in both cases according to the Kolmogorov–Smirnov test. The same differences are observed for the VMP sample, but in this case the statistical significance is only marginal for the comparison of the |LZ| distributions and negligible for the eccentricity distributions; this likely owes to the much smaller sample size with respect to the MP case. However, the fact that the |LZ| value at which the maximum difference between the prograde and retrograde distributions is basically the same for the MP (|LZ| = 878 km s−1 kpc) and VMP (|LZ| = 912 km s−1 kpc) cases strongly supports the hypothesis that the two subsamples have the same behaviour in this respect. Concerning eccentricity, the largest difference in the distributions is found at ϵ = 0.16 for the VMP and at ϵ = 0.25 for the MP. In both cases an excess of low eccentricity orbits among the prograde stars with respect to their retrograde counterparts.
To better understand the reasons of the differences between the prograde and retrograde metal-poor disc populations, in Fig. 3 we compare the |LZ| distributions again, but this time in differential form and merging the MP and VMP samples and restricting to stars on moderate eccentricity orbits (ϵ < 0.5; 517 prograde and 124 retrograde stars). It is interesting to note that the two distributions have similar characteristic shapes, with a main peak around |LZ| = 900 km s−1 kpc and a long declining tail toward higher |LZ| values, but the distribution of the prograde stars displays an additional broad component peaking at |LZ|∼1200 km s−1 kpc. This is similar to the metal-weak thick disc component discussed by Carollo et al. (2019), but in a different metallicity regime, as the stars they attribute to that component have −1.2 < [Fe/H] < −0.6, while those considered here have [Fe/H] ≤ −1.5. From the perspective of the metallicity range our sample is more akin to the metal-weak thick disc as defined and studied by Li & Zhao (2017).
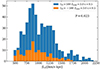 |
Fig. 3. Comparison of |LZ| distributions for samples of prograde (blue) and retrograde (orange) stars with disc-like orbits (as defined in Fig. 2) and low orbital eccentricity (ϵ < 0.5). All stars with [Fe/H] ≤ −1.5 are included in the comparison. The probability that the two samples are drawn from the same parent population in |LZ| according to a Kolmogorov–Smirnov test is also reported. |
2.2. The early evolution of the MW disc
In a recent paper Belokurov & Kravtsov (2022, hereafter BK22), based on evidence drawn from the analysis of a sample selected from the APOGEE DR17 dataset (Abdurro’uf et al. 2022), presented an intriguing view of the evolution of the Galactic disc from an initial chaotic, relatively metal-poor phase (that they dub Aurora) to the present-day cold disc stage through a rapid spinning-up phase that occurred while the mean metallicity of the stars grew from [Fe/H] ≃ −1.5 to [Fe/H] ≃ −0.9. They provided both observational and theoretical support for a phase transition between a regime in which gas accretion in the pristine Galaxy occurs mainly in an irregular and turbulent fashion from narrow filamentary flows to a regime of more ordered accretion via cooling flows from a hot gaseous halo, leading to the formation of a coherently rotating disc (see also Rix et al. 2022; Xiang & Rix 2022; Conroy et al. 2022; for a study of the process from the theoretical side, see Dillamore et al. 2024 and references therein). Recently, Chandra et al. (2023) presented a very similar view of the evolution of the discy components of the MW from the analysis of a large set of giant stars with photometric metallicities and [α/Fe] ratios and of simulations of MW analogues from the IllustrisTNG suite (Pillepich et al. 2018). In this section, we discuss how the results presented in this paper fit into the BK22 framework. Here it is worth noting that in a galaxy formation process driven by hierarchical merging the definition of in situ becomes blurred at early times, before a relatively stable gaseous disc is settled. Hence, in the MP and VMP regimes on which we are mainly focusing our attention, in situ broadly denotes the early epoch in which the first building blocks were merging together to form the seed of our own Galaxy (see, e.g. BK22; Sestito et al. 2021; Chandra et al. 2023).
Being interested to stars born in-situ in the Galaxy, BK22 effectively remove the stars that have been most likely accreted during merger events using the remarkable discriminating power of the [Al/Fe] abundance (Hawkins et al. 2015). Using [Al/Fe] and energy constraints, they finally selected a local sample of ≃80 000 in situ stars, most of which are lying in the −1.7 ≲ [Fe/H] ≲ 0.5 range. It turns out that the vast majority of in situ stars selected by BK22 are confined in the range of orbital energy −0.75 × 10⁵ km2 s−2 < E < −0.4 × 10⁵ km2 s−2; hence, we can use a cut in energy to draw a sub-sample that should be dominated by in situ stars from our sample, roughly approximating the BK22 selection. This will allow us to reconsider the issue discussed in Sect. 2.1 from a different perspective, checking if we obtain consistent results and how they fit into the scenario depicted by BK22.
Since the Galactic potentials adopted by us and by BK22 are different, the energy scale is also different. We used 51 460 stars in common between our sample and the dataset from which they draw the orbital parameters and integrals of motion for their stars (the astroNN6 value added catalogue, Leung & Bovy 2019) to fit a linear relation translating energy values from one scale to the other: Et.w. = 1.097 EBK22 − 1.12 × 10⁵. The relation is linear (Pearson’s linear correlation coefficient ρ = 0.972) and very tight (rms = 0.03 × 10⁵ km2 s−2), especially in the −2.3 × 10⁵ km2 s−2 ≲ E ≲ −1.2 × 10⁵ km2 s−2 energy range, which widely encloses the most relevant range for the following analysis. With this relation the energy window for in situ stars in our scale is −1.95 × 10⁵ km2 s−2 < E < −1.56 × 10⁵ km2 s−2. This window is represented by two parallel dotted lines in each panel of Fig. 4, where the wealth of dynamical structures in our sample is displayed in the LZ − E plane sliced by metallicity. In the lowest panels the prograde-retrograde asymmetry in fast-rotating MP and VMP stars can be clearly appreciated. This figure allows a clear and direct comparison with BK22 (see their Fig. 1 in particular).
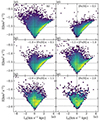 |
Fig. 4. 2D histograms of stars in our sample in angular momentum versus orbital energy plane. The distribution is shown for the entire sample (upper left panel) and for different metallicity slices, from the most metal-rich (upper right panel) to the most metal-poor (lower right panel). The vertical continuous line separates prograde from retrograde orbits (to the right and to the left of the line, respectively). The two dotted horizontal lines enclose the energy slice that should be dominated by in situ stars, following BK22. |
The [Fe/H] versus VΦ distribution of the 446 754 stars in our sample enclosed in this in situ energy window is displayed in Fig. 5, which is fully analogue to the lower right panel of Fig. 3 of BK22. Here, we reproduce the BK22 result with a much larger sample7 (see also Chandra et al. 2023). At the earliest epochs ([Fe/H] ≤ −1.5) the net rotation of in situ stars is very low, or null, and the dispersion is high (≃150 km s−1). In the range between [Fe/H] ≳ −1.5 and [Fe/H] ≲ −0.9, there is a strong increase in the median azimuthal velocity, up to about VΦ = 130 km s−1. Then, the increase in VΦ becomes much milder, flattening out at VΦ ≃ 210 km s−1 for [Fe/H] ≳ 0.0, while the dispersion shrinks to a few tens of km s−1. The only small difference with respect to BK22 is that the median azimuthal velocity in our sample of putative in situ stars seems to reach VΦ = 0.0 km s−1 only for [Fe/H] ≲ −2.5, while it is VΦ ≃ 20 km s−1 at [Fe/H] ≃ −2.0 and VΦ ≃ 40 km s−1 at [Fe/H] ≃ −1.5 (in excellent agreement with the median trend measured in MW-like galaxy models by Dillamore et al. 2024, see, in particular, their Fig. 1)8, possibly suggesting a mild spinning-up also at very early epochs or, in other words, a pristine prevalence of stars rotating in the sense that will become largely dominant in the mature phases of the disc evolution.
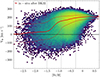 |
Fig. 5. Distribution in metallicity versus azimuthal velocity for 446 754 stars in our sample that were likely born in situ according the selection in orbital energy shown by BK22 in their Fig. 1. The thick red line traces the median VΦ of the distribution, while the thinner lines trace the 5th and 95th percentiles. The vertical grey lines mark the transition points suggested by BK22, [Fe/H] = −0.3 and [Fe/H] = −0.9, as well as the lower limit of the metallicity range in which the same trend is discussed in BK22: [Fe/H] = −1.5 (see their Fig. 4). |
This conclusion is supported by the distributions in LZ of the in situ stars with [Fe/H] ≤ −1.5 and [Fe/H] ≤ −2.0 shown in Fig. 6. The prograde-to-retrograde asymmetry is also already in place in these metallicity ranges for in situ stars, either by number, with 3394 prograde stars and 2033 retrograde stars for the MP+VMP sample and 734 prograde stars and 509 retrograde stars for the VMP sample, and by shape. In particular, in the MP+VMP case the retrograde side of the distribution is smooth and (half-)bell-shaped, while the prograde side has much more power at high |LZ| values (the same is true if one looks at the high VΦ distribution). The difference between the two halves of the distribution is significant in both metallicity ranges. According to a Kolmogorov–Smirnov test the probability that the positive and negative sides of the distributions shown in Fig. 6 are drawn from the same parent distribution of |LZ| is P = 6.6 × 10⁻²⁹ for the MP+VMP sample and P = 0.010 for the smaller VMP sample.
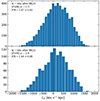 |
Fig. 6. LZ distributions of in situ stars with [Fe/H] ≤ −1.5 (MP+VMP; upper panel) and with [Fe/H] ≤ −2.0 (VMP; lower panel). The prograde-to-retrograde ratio P/R is reported in each panel for the considered sub-sample. |
3. Summary and conclusions
We used the dataset by B23 to study the properties of the MP (−2.0 < [Fe/H] ≤ −1.5) and VMP ([Fe/H] ≤ −2.0) stars with disc-like orbits in the vicinity of the Sun. We confirm the significant prevalence of prograde over retrograde disc-like stars over the entire metallicity range considered. We also show that in both MP and VMP sub-samples, prograde stars with high planar rotation and low eccentricity are much more frequent than retrograde stars with the same properties. The differences in the |LZ| and ϵ distributions of the MP sample have very high statistical significance. For the first time, a qualitative asymmetry seems to emerge between the prograde and retrograde metal-poor disc-like populations, in addition to the quantitative one already noted and discussed by other authors (see Sestito et al. 2020; Carter et al. 2021; Carollo et al. 2023, and references therein). This has been made possible by the larger sample of MP stars with excellent measures of the 6D phase space parameters that we were able to analyse here, with respect to previous studies.
Merging the MP and VMP stars and restricting our study to moderate-eccentricity stars (ϵ < 0.5), we found that the |LZ| distribution of prograde stars appears bimodal, with a secondary peak at relatively high planar rotation that seems to lack a counterpart in the retrograde sample, possibly hinting at the presence of two different disc-like components on the prograde side.
A sizeable fraction of metal-poor stars on disc-like orbits have been found by various authors in recent physically motivated numerical simulations of galaxies similar to the MW (Sestito et al. 2021; Santistevan et al. 2021; Carollo et al. 2023; Sotillo-Ramos et al. 2023), with non-negligible galaxy-to-galaxy differences. For instance, Sotillo-Ramos et al. (2023) found that the fraction of VMP stars in the cold disc of the model galaxies they analysed may vary from about 5−10% up to about 40% in the most extreme cases, with typical values around 20%. All these studies agree that accretion is the dominant channel for the build up of the extremely metal-poor disc-like population ([Fe/H] < −2.5), but Carollo et al. (2023) highlighted that in situ formation may also contribute, and Sotillo-Ramos et al. (2023) found that the fraction of disc stars formed in-situ decreases with decreasing metallicity (in agreement with Conroy et al. 2019), from about 70% around [Fe/H] ≃ −1.0 to less than 50% for [Fe/H] ≲ −3.0. This is for their warm disc component, which is the one more akin to the sample studied here. In a recent analysis of 24 MW analogues from the AURIGA simulation (Grand et al. 2017) aimed at studying the origin of the thick and thin discs in an extragalactic context, Pinna et al. (2024) concluded that thick discs mostly formed in situ and at very early times, albeit with a significant contribution of satellite mergers. On the other hand, Santistevan et al. (2021) found that the typical, most important contributor to the prevalence of prograde over retrograde stars in their set of MW analogues is a single early galaxy merger, which may also play a significant role in the build-up of the MW disc (see also Chandra et al. 2023). Similarly to Santistevan et al. (2021), Sestito et al. (2021), who studied the origin of VMP stars in five high-resolution MW-like galaxies from the NIHAO-UHD simulations (Buck et al. 2020), concluded that VMP disc-like stars are mainly contributed by major building blocks during the early assembly phase of the MW, but they can also be brought in during later merging events, when prograde satellites are more easily dragged into the already-formed MW disc than retrograde ones.
In any case, in the range of metallicity explored in the present study, a non-negligible very early component of the metal-poor disc is expected, born either in the initial most massive seed of the MW assembly (in situ) or in one of the building blocks that merged with that seed at very early epochs. We speculate that the population producing the prograde-to-retrograde differences in the |LZ| and ϵ distributions shown in Fig. 2, as well as the high |LZ| peak that we identified in the |LZ| distribution of prograde stars with ϵ < 0.5 (shown in Fig. 3), can be such a pristine component.
This hypothesis is supported by the results we obtained from the analysis of a large sub-sample that should be dominated by stars classified as in situ, following the approach of BK22. We were able to reproduce the trend of the median and the dispersion in azimuthal velocity very well and with a much larger sample (446 754 stars vs. the ≃79 500 used by BK22), with metallicity first highlighted by BK22, and interpreted by these authors as the transition from a pristine, very chaotic phase (Aurora, [Fe/H] ≲ −1.5) to a spinning-up and more ordered gas accretion phase that lead to the formation of the present-day disc (see also Rix et al. 2022; Conroy et al. 2022; Dillamore et al. 2024; Chandra et al. 2023; Semenov et al. 2024). The larger sample also allowed us to trace the trend of median azimuthal velocity with [Fe/H] to much lower metallicity than BK22 (beyond [Fe/H] = −2.0, while they reach [Fe/H] ≃ −1.5) and Chandra et al. (2023), who limited their analysis to [Fe/H] = −2.0. We showed that, even in the Aurora phase, there was a clear prevalence of prograde stars over retrograde ones, and the |LZ| distribution of prograde stars was significantly more skewed towards high values (i.e. stronger rotation) than its retrograde counterpart.
In this context, it seems worth mentioning the results of two very recent analyses of large samples of local stars based on two different sets of photometric metallicities. Zhang et al. (2023) suggested that metal-poor stars with disc-like orbits are not a special MW component in the metal-poor regime, but just the subset of halo stars that is expected to have prograde and low- Zmax orbits, with the prevalence of prograde stars being due to a slightly prograde halo component. They showed that the distribution of ϵ of Zmax ≤ 3.0 kpc in their sample begins to show a prevalence of low-eccentricity orbits only for [Fe/H] > −1.3, while at lower metallicity it appears indistinguishable from that of a simulated non-rotating halo population. Here we note that, in our MP sample with Zmax ≤ 3.0 kpc, the prograde population shows a clear low-eccentricity component (peaking at ϵ ≃ 0.3 − 0.4) that has no counterpart in the retrograde population. Hence, the results shown in Fig. 2 remain valid even if the constraint on |LZ| adopted there is dropped, an occurrence that seems difficult to explain with just a non-rotating halo. In line with this, Hong et al. (2023) trace a disc-like component in the local Galaxy down to [Fe/H] ≲ −3.0, suggesting the presence of a forming disc at very early epochs.
In summary, our results suggest that, in addition to a symmetric, accreted, disc-like component, the seed of what lately evolved into the Galactic disc was already present at very early epochs and is clearly visible in the surroundings of the Sun, in the metal-poor regime, at least when a large sample of stars with accurate metallicity, distance, and kinematic measures is considered. As a final consideration, we feel that in the last decade we are just beginning to trace the early assembly phase of the MW disc. As usual, scientists trying to tackle the problem from different perspectives provide different valuable pieces of information that take some time to find their place together into a global picture. We think that the present contribution may be a useful step in bridging two approaches to the early formation of the disc, one focusing on relatively small samples of very and extremely metal-poor stars, like, e.g., Sestito et al. (2019, 2020), Cordoni et al. (2021), Carollo et al. (2023), with the possiblity of deeper insight from detailed chemical composition (Dovgal et al. 2024), and the other trying to reconstruct the main phases of the evolutionary path with large samples limited to a metallicity range ([Fe/H] ≳ −1.5) where local disc stars are more abundant (like, e.g., BK22; Xiang & Rix 2022; Chandra et al. 2023).
Half of the B23 stars lie within 2.4 kpc from the Sun while 95% of them lie within ≃5.1 kpc.
An alternative view is provided in Fig. 4, below.
Defined as ϵ = (rapo − rperi)/(rapo + rperi), where rapo and rperi are the apogalactic and perigalactic distances, respectively.
The three low-eccentricity stars with [Fe/H] < −1.0 around LZ ≃ −1500 km s−1 kpc have also virtually the same energy and have properties quite similar to Thamnos (Koppelman et al. 2019a) stars. However, neither Dodd et al. (2023) nor B23 associated them with this substructure, due to their extreme LZ and ϵ values with respect to the typical ranges adopted to define it.
However, it must be noted that the selection in Zmax imposes a lower limit in energy, and LZ and energy are correlated for strongly rotating, low-eccentricity stars. Hence, the fact that these stars are enclosed in a relatively narrow range in energy may not be particularly significant.
It is worth noting here that the adopted energy cuts were effective in removing most of the stars associated with GES and other high-energy substructures (see B23) and allowed us to obtain a cleaner reproduction of the BK22 result, improving the consistency between the two analyses. However, the general trends of the median and of the dispersion shown in Fig. 5 also emerge quite clearly when the entire B23 sample is considered.
In a previous contribution, Dillamore et al. (2023) suggested that bar resonances may drive stars from the inner Galaxy to the solar neighbourhood on nearly circular orbits. However, in their recent analysis, Yuan et al. (2023) concluded that this mechanism is not able to produce the observed local population of metal-poor stars on prograde disc-like orbits.
Acknowledgments
M.B., P.M., A.B., and D.M. acknowledge the support to activities related to the ESA/Gaia mission by the Italian Space Agency (ASI) through contract 2018-24-HH.0 and its addendum 2018-24-HH.1-2022 to the National Institute for Astrophysics (INAF). M.B., E.C., D.M., and A.M. acknowledge the support to this study by the PRIN INAF Mini Grant 2023 (Ob.Fu. 1.05.23.04.02 – CUP C33C23000960005) CHAM – Chemo-dynamics of the Accreted Halo of the Milky Way (P.I.: M. Bellazzini) and by the project LEGO – Reconstructing the building blocks of the Galaxy by chemical tagging (P.I.: A. Mucciarelli), granted by the Italian MUR through contract PRIN 2022LLP8TK_001, financially supported by the European Union – Next Generation EU. M.B. is grateful to R. Pascale for his help in the production of figures with Python. We are grateful to an anonymous Referee for constructive comments that helped us to improve the paper. This work has made use of data from the European Space Agency (ESA) mission Gaia (https://www.cosmos.esa.int/Gaia), processed by the Gaia Data Processing and Analysis Consortium (DPAC, https://www.cosmos.esa.int/web/Gaia/dpac/consortium). Funding for the DPAC has been provided by national institutions, in particular the institutions participating in the Gaia Multilateral Agreement. In this analysis we made use of TOPCAT (http://www.starlink.ac.uk/topcat/, Taylor 2005).
References
- Abdurro’uf, Accetta, K., Aerts, C., et al. 2022, ApJS, 259, 35 [NASA ADS] [CrossRef] [Google Scholar]
- Andrae, R., Rix, H.-W., & Chandra, V. 2023, ApJS, 267, 8 [NASA ADS] [CrossRef] [Google Scholar]
- Beers, T. C., Norris, J. E., Placco, V. M., et al. 2014, ApJ, 794, 58 [NASA ADS] [CrossRef] [Google Scholar]
- Bellazzini, M., Massari, D., De Angeli, F., et al. 2023, A&A, 674, A194 [NASA ADS] [CrossRef] [EDP Sciences] [Google Scholar]
- Belokurov, V., & Kravtsov, A. 2022, MNRAS, 514, 689 [NASA ADS] [CrossRef] [Google Scholar]
- Belokurov, V., Erkal, D., Evans, N. W., Koposov, S. E., & Deason, A. J. 2018, MNRAS, 478, 611 [Google Scholar]
- Belokurov, V., Sanders, J. L., Fattahi, A., et al. 2020, MNRAS, 494, 3880 [Google Scholar]
- Buck, T., Obreja, A., Macciò, A. V., et al. 2020, MNRAS, 491, 3461 [Google Scholar]
- Calamida, A., Bono, G., Stetson, P. B., et al. 2007, ApJ, 670, 400 [Google Scholar]
- Carollo, D., Chiba, M., Ishigaki, M., et al. 2019, ApJ, 887, 22 [NASA ADS] [CrossRef] [Google Scholar]
- Carollo, D., Christlieb, N., Tissera, P. B., & Sillero, E. 2023, ApJ, 946, 99 [NASA ADS] [CrossRef] [Google Scholar]
- Carter, C., Conroy, C., Zaritsky, D., et al. 2021, ApJ, 908, 208 [NASA ADS] [CrossRef] [Google Scholar]
- Chandra, V., Semenov, V. A., Rix, H.-W., et al. 2023, ApJ, submitted [arXiv:2310.13050] [Google Scholar]
- Conroy, C., Naidu, R. P., Zaritsky, D., et al. 2019, ApJ, 887, 237 [NASA ADS] [CrossRef] [Google Scholar]
- Conroy, C., Weinberg, D. H., Naidu, R. P., et al. 2022, ApJ, submitted [arXiv:2204.02989] [Google Scholar]
- Cordoni, G., Da Costa, G. S., Yong, D., et al. 2021, MNRAS, 503, 2539 [NASA ADS] [CrossRef] [Google Scholar]
- Dillamore, A. M., Belokurov, V., Evans, N. W., & Davies, E. Y. 2023, MNRAS, 524, 3596 [NASA ADS] [CrossRef] [Google Scholar]
- Dillamore, A. M., Belokurov, V., Kravtsov, A., & Font, A. S. 2024, MNRAS, 527, 7070 [Google Scholar]
- Dodd, E., Callingham, T. M., Helmi, A., et al. 2023, A&A, 670, L2 [NASA ADS] [CrossRef] [EDP Sciences] [Google Scholar]
- Dovgal, A., Venn, K. A., Sestito, F., et al. 2024, MNRAS, 527, 7810 [Google Scholar]
- El-Badry, K., Bland-Hawthorn, J., Wetzel, A., et al. 2018, MNRAS, 480, 652 [NASA ADS] [CrossRef] [Google Scholar]
- Gaia Collaboration (Vallenari, A., et al.) 2023, A&A, 674, A1 [NASA ADS] [CrossRef] [EDP Sciences] [Google Scholar]
- Grand, R. J. J., Gómez, F. A., Marinacci, F., et al. 2017, MNRAS, 467, 179 [NASA ADS] [Google Scholar]
- Hawkins, K., Jofré, P., Masseron, T., & Gilmore, G. 2015, MNRAS, 453, 758 [NASA ADS] [CrossRef] [Google Scholar]
- Helmi, A., Babusiaux, C., Koppelman, H. H., et al. 2018, Nature, 563, 85 [Google Scholar]
- Hong, J., Beers, T. C., Lee, Y. S., et al. 2023, ApJS, submitted [arXiv:2311.02297] [Google Scholar]
- Hopkins, P. F., Wetzel, A., Kereš, D., et al. 2018, MNRAS, 480, 800 [NASA ADS] [CrossRef] [Google Scholar]
- Ibata, R. A., Malhan, K., & Martin, N. F. 2019, ApJ, 872, 152 [Google Scholar]
- Ibata, R., Malhan, K., Martin, N., et al. 2021, ApJ, 914, 123 [NASA ADS] [CrossRef] [Google Scholar]
- Ivezić, Ž., Sesar, B., Jurić, M., et al. 2008, ApJ, 684, 287 [Google Scholar]
- Katz, D., Sartoretti, P., Guerrier, A., et al. 2023, A&A, 674, A5 [NASA ADS] [CrossRef] [EDP Sciences] [Google Scholar]
- Koppelman, H. H., Helmi, A., Massari, D., Roelenga, S., & Bastian, U. 2019a, A&A, 625, A5 [NASA ADS] [CrossRef] [EDP Sciences] [Google Scholar]
- Koppelman, H. H., Helmi, A., Massari, D., Price-Whelan, A. M., & Starkenburg, T. K. 2019b, A&A, 631, L9 [NASA ADS] [CrossRef] [EDP Sciences] [Google Scholar]
- Leung, H. W., & Bovy, J. 2019, MNRAS, 489, 2079 [CrossRef] [Google Scholar]
- Li, C., & Zhao, G. 2017, ApJ, 850, 25 [NASA ADS] [CrossRef] [Google Scholar]
- Malhan, K., Yuan, Z., Ibata, R. A., et al. 2021, ApJ, 920, 51 [NASA ADS] [CrossRef] [Google Scholar]
- Martin, N. F., Ibata, R. A., Starkenburg, E., et al. 2022, MNRAS, 516, 5331 [NASA ADS] [CrossRef] [Google Scholar]
- Martin, N. F., Starkenburg, E., Yuan, Z., et al. 2023, A&A, submitted [arXiv:2308.01344] [Google Scholar]
- McMillan, P. J. 2017, MNRAS, 465, 76 [NASA ADS] [CrossRef] [Google Scholar]
- Miranda, M. S., Pilkington, K., Gibson, B. K., et al. 2016, A&A, 587, A10 [NASA ADS] [CrossRef] [EDP Sciences] [Google Scholar]
- Myeong, G. C., Vasiliev, E., Iorio, G., Evans, N. W., & Belokurov, V. 2019, MNRAS, 488, 1235 [Google Scholar]
- Naidu, R. P., Conroy, C., Bonaca, A., et al. 2020, ApJ, 901, 48 [Google Scholar]
- Necib, L., Ostdiek, B., Lisanti, M., et al. 2020, Nat. Astron., 4, 1078 [NASA ADS] [CrossRef] [Google Scholar]
- Pillepich, A., Nelson, D., Hernquist, L., et al. 2018, MNRAS, 475, 648 [Google Scholar]
- Pinna, F., Walo-Martín, D., Grand, R. J. J., et al. 2024, A&A, in press, https://doi.org/10.1051/0004-6361/202347388 [Google Scholar]
- Re Fiorentin, P., Spagna, A., Lattanzi, M. G., & Cignoni, M. 2021, ApJ, 907, L16 [NASA ADS] [CrossRef] [Google Scholar]
- Rix, H.-W., Chandra, V., Andrae, R., et al. 2022, ApJ, 941, 45 [NASA ADS] [CrossRef] [Google Scholar]
- Ruchti, G. R., Fulbright, J. P., Wyse, R. F. G., et al. 2010, ApJ, 721, L92 [NASA ADS] [CrossRef] [Google Scholar]
- Santistevan, I. B., Wetzel, A., Sanderson, R. E., et al. 2021, MNRAS, 505, 921 [NASA ADS] [CrossRef] [Google Scholar]
- Semenov, V. A., Conroy, C., Chandra, V., Hernquist, L., & Nelson, D. 2023, ApJ, submitted [arXiv:2306.13125] [Google Scholar]
- Semenov, V. A., Conroy, C., Chandra, V., Hernquist, L., & Nelson, D. 2024, ApJ, 962, 84 [NASA ADS] [CrossRef] [Google Scholar]
- Sestito, F., Longeard, N., Martin, N. F., et al. 2019, MNRAS, 484, 2166 [NASA ADS] [CrossRef] [Google Scholar]
- Sestito, F., Martin, N. F., Starkenburg, E., et al. 2020, MNRAS, 497, L7 [Google Scholar]
- Sestito, F., Buck, T., Starkenburg, E., et al. 2021, MNRAS, 500, 3750 [Google Scholar]
- Sotillo-Ramos, D., Bergemann, M., Friske, J. K. S., & Pillepich, A. 2023, MNRAS, 525, L105 [NASA ADS] [CrossRef] [Google Scholar]
- Taylor, M. B. 2005, in Astronomical Data Analysis Software and Systems XIV, eds. P. Shopbell, M. Britton, & R. Ebert, ASP Conf. Ser., 347, 29 [Google Scholar]
- Vasiliev, E. 2019, MNRAS, 482, 1525 [Google Scholar]
- Xiang, M., & Rix, H.-W. 2022, Nature, 603, 599 [NASA ADS] [CrossRef] [Google Scholar]
- Xu, S., Yuan, H., Niu, Z., et al. 2022, ApJS, 258, 44 [NASA ADS] [CrossRef] [Google Scholar]
- Yang, L., Yuan, H., Xiang, M., et al. 2022, A&A, 659, A181 [NASA ADS] [CrossRef] [EDP Sciences] [Google Scholar]
- Yuan, Z., Li, C., Martin, N. F., et al. 2023, A&A, submitted [arXiv:2311.08464] [Google Scholar]
- Zhang, H., Ardern-Arentsen, A., & Belokurov, V. 2023, MNRAS, submitted [arXiv:2311.09294] [Google Scholar]
All Figures
|
Fig. 1. Metallicity of stars in our sample versus component of angular momentum perpendicular to disc plane for three different slices in the maximum absolute height over the Galactic plane reached by the star orbit. Points are colour-coded according to the orbital eccentricity. The thin black lines are at LZ = ±500 km s−1 kpc, while the grey line marks the Z angular momentum of the Sun: LZ = 1909 km s−1 kpc in the adopted reference frame. The sub-samples plotted in the various panels contain 185 178, 580 551, and 104 530 stars, respectively, from top to bottom. |
| In the text | |
|
Fig. 2. Comparison of cumulative distributions of |LZ| and orbital eccentricity for prograde (blue) and retrograde (orange) sub-samples of the stars with |LZ|> 500 km s−1 kpc and Zmax < 3.0 kpc. The comparisons are performed separately for MP (834 stars, left column of panels) and VMP stars (193 stars, right column of panels). In the upper left corner of each panel, we report the probability that the prograde and retrograde samples are drawn from the same parent distribution in the considered quantity, according to a Kolmogorov–Smirnov test. |
| In the text | |
|
Fig. 3. Comparison of |LZ| distributions for samples of prograde (blue) and retrograde (orange) stars with disc-like orbits (as defined in Fig. 2) and low orbital eccentricity (ϵ < 0.5). All stars with [Fe/H] ≤ −1.5 are included in the comparison. The probability that the two samples are drawn from the same parent population in |LZ| according to a Kolmogorov–Smirnov test is also reported. |
| In the text | |
|
Fig. 4. 2D histograms of stars in our sample in angular momentum versus orbital energy plane. The distribution is shown for the entire sample (upper left panel) and for different metallicity slices, from the most metal-rich (upper right panel) to the most metal-poor (lower right panel). The vertical continuous line separates prograde from retrograde orbits (to the right and to the left of the line, respectively). The two dotted horizontal lines enclose the energy slice that should be dominated by in situ stars, following BK22. |
| In the text | |
|
Fig. 5. Distribution in metallicity versus azimuthal velocity for 446 754 stars in our sample that were likely born in situ according the selection in orbital energy shown by BK22 in their Fig. 1. The thick red line traces the median VΦ of the distribution, while the thinner lines trace the 5th and 95th percentiles. The vertical grey lines mark the transition points suggested by BK22, [Fe/H] = −0.3 and [Fe/H] = −0.9, as well as the lower limit of the metallicity range in which the same trend is discussed in BK22: [Fe/H] = −1.5 (see their Fig. 4). |
| In the text | |
|
Fig. 6. LZ distributions of in situ stars with [Fe/H] ≤ −1.5 (MP+VMP; upper panel) and with [Fe/H] ≤ −2.0 (VMP; lower panel). The prograde-to-retrograde ratio P/R is reported in each panel for the considered sub-sample. |
| In the text | |
Current usage metrics show cumulative count of Article Views (full-text article views including HTML views, PDF and ePub downloads, according to the available data) and Abstracts Views on Vision4Press platform.
Data correspond to usage on the plateform after 2015. The current usage metrics is available 48-96 hours after online publication and is updated daily on week days.
Initial download of the metrics may take a while.