Fig. 4.
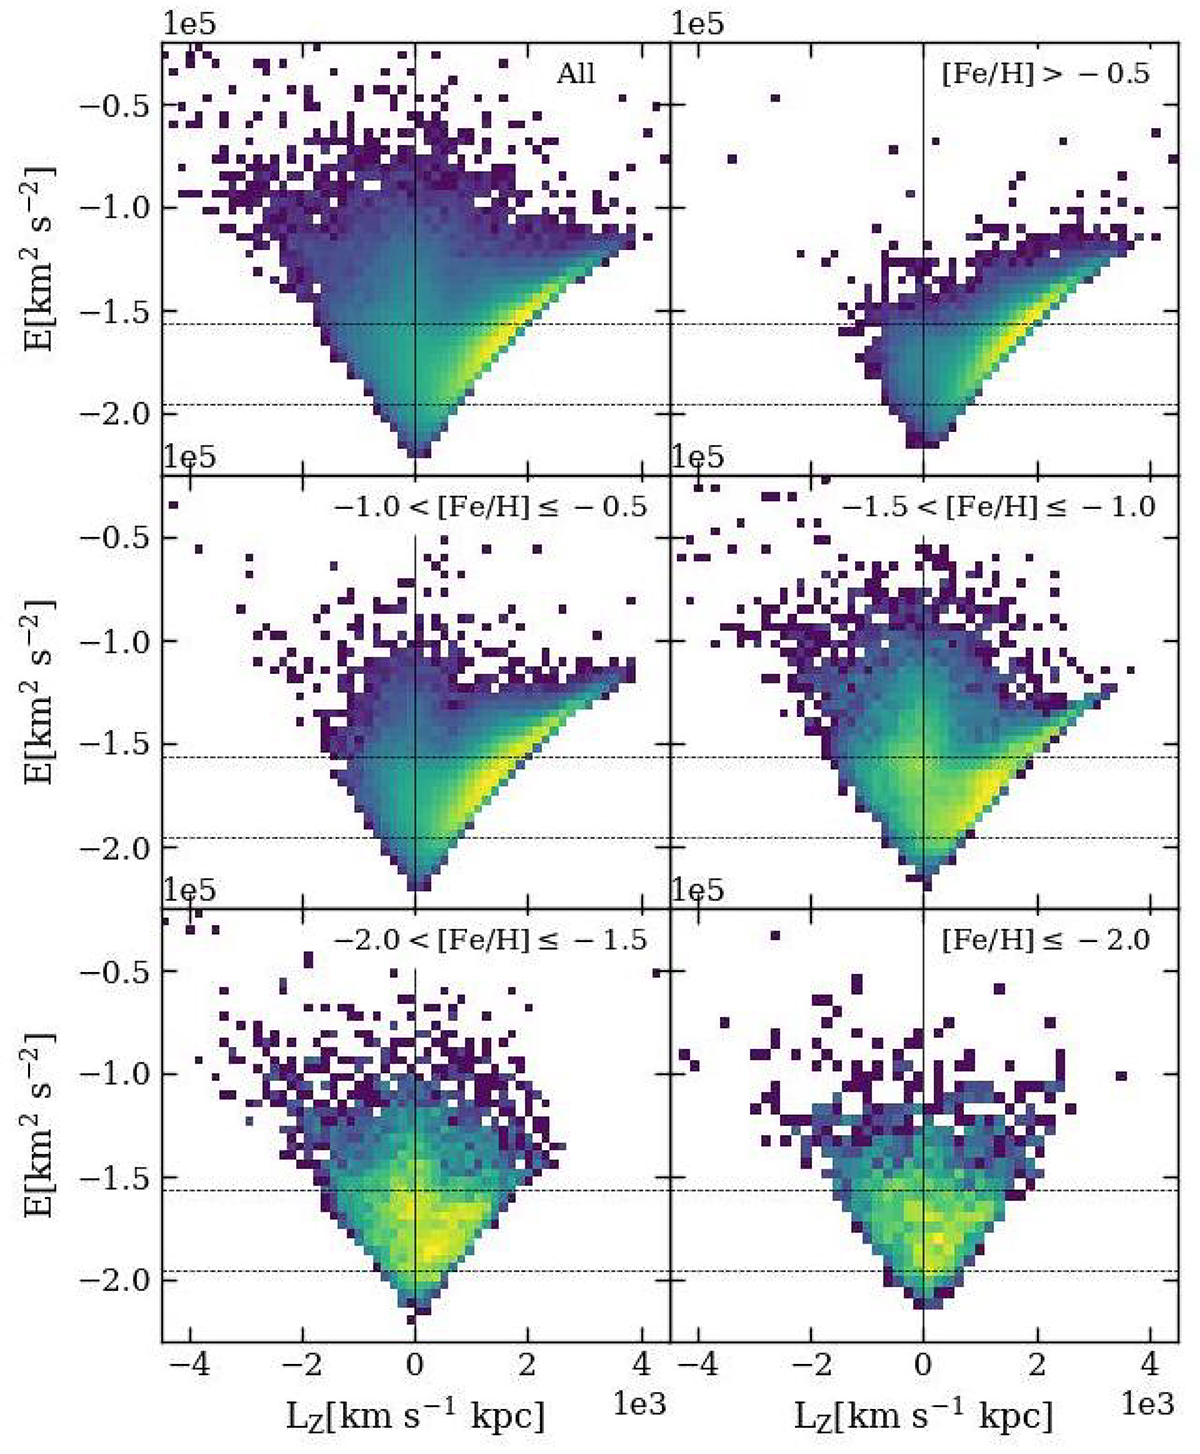
Download original image
2D histograms of stars in our sample in angular momentum versus orbital energy plane. The distribution is shown for the entire sample (upper left panel) and for different metallicity slices, from the most metal-rich (upper right panel) to the most metal-poor (lower right panel). The vertical continuous line separates prograde from retrograde orbits (to the right and to the left of the line, respectively). The two dotted horizontal lines enclose the energy slice that should be dominated by in situ stars, following BK22.
Current usage metrics show cumulative count of Article Views (full-text article views including HTML views, PDF and ePub downloads, according to the available data) and Abstracts Views on Vision4Press platform.
Data correspond to usage on the plateform after 2015. The current usage metrics is available 48-96 hours after online publication and is updated daily on week days.
Initial download of the metrics may take a while.