| Issue |
A&A
Volume 683, March 2024
|
|
|---|---|---|
| Article Number | A70 | |
| Number of page(s) | 9 | |
| Section | Extragalactic astronomy | |
| DOI | https://doi.org/10.1051/0004-6361/202348063 | |
| Published online | 06 March 2024 | |
TeV flaring activity of the AGN PKS 0625–354 in November 2018
1
Dublin Institute for Advanced Studies, 31 Fitzwilliam Place, Dublin 2, Ireland
2
Max-Planck-Institut für Kernphysik, PO Box 103980 69029 Heidelberg, Germany
3
Yerevan State University, 1 Alek Manukyan St, Yerevan 0025, Armenia
4
Landessternwarte, Universität Heidelberg, Königstuhl, 69117 Heidelberg, Germany
5
Kapteyn Astronomical Institute, University of Groningen, Landleven 12, 9747 AD Groningen, The Netherlands
6
Laboratoire Leprince-Ringuet, École Polytechnique, CNRS, Institut Polytechnique de Paris, 91128 Palaiseau, France
7
University of Namibia, Department of Physics, Private Bag 13301, Windhoek 10005, Namibia
8
Centre for Space Research, North-West University, Potchefstroom 2520, South Africa
9
Universität Hamburg, Institut für Experimentalphysik, Luruper Chaussee 149, 22761 Hamburg, Germany
10
Deutsches Elektronen-Synchrotron DESY, Platanenallee 6, 15738 Zeuthen, Germany
11
Department of Physics, University of the Free State, PO Box 339 Bloemfontein 9300, South Africa
12
Institut für Physik und Astronomie, Universität Potsdam, Karl-Liebknecht-Strasse 24/25, 14476 Potsdam, Germany
13
Université de Paris, CNRS, Astroparticule et Cosmologie, 75013 Paris, France
14
Department of Physics and Electrical Engineering, Linnaeus University, 351 95 Växjö, Sweden
15
Institut für Physik, Humboldt-Universität zu Berlin, Newtonstr. 15, 12489 Berlin, Germany
16
Institut für Astronomie und Astrophysik, Universität Tübingen, Sand 1, 72076 Tübingen, Germany
17
Laboratoire Univers et Théories, Observatoire de Paris, Université PSL, CNRS, Université Paris Cité, 5 Pl. Jules Janssen, 92190 Meudon, France
18
Sorbonne Université, Université Paris Diderot, Sorbonne Paris Cité, CNRS/IN2P3, Laboratoire de Physique Nucléaire et de Hautes Energies, LPNHE, 4 Place Jussieu, 75252 Paris, France
19
IRFU, CEA, Université Paris-Saclay, 91191 Gif-sur-Yvette, France
20
University of Oxford, Department of Physics, Denys Wilkinson Building, Keble Road, Oxford OX1 3RH, UK
21
Friedrich-Alexander-Universität Erlangen-Nürnberg, Erlangen Centre for Astroparticle Physics, Nikolaus-Fiebiger-Str. 2, 91058 Erlangen, Germany
22
Astronomical Observatory, The University of Warsaw, Al. Ujazdowskie 4, 00-478 Warsaw, Poland
23
Université Savoie Mont Blanc, CNRS, Laboratoire d’Annecy de Physique des Particules – IN2P3, 74000 Annecy, France
24
Instytut Fizyki Jdrowej PAN, ul. Radzikowskiego 152, 31-342 Kraków, Poland
25
School of Physics, University of the Witwatersrand, 1 Jan Smuts Avenue, Braamfontein, Johannesburg 2050, South Africa
26
School of Physical Sciences, University of Adelaide, Adelaide 5005, Australia
27
Aix Marseille Université, CNRS/IN2P3, CPPM, Marseille, France
28
Universität Innsbruck, Institut für Astro- und Teilchenphysik, Technikerstraße 25, 6020 Innsbruck, Austria
29
Obserwatorium Astronomiczne, Uniwersytet Jagielloński, ul. Orla 171, 30-244 Kraków, Poland
30
Institute of Astronomy, Faculty of Physics, Astronomy and Informatics, Nicolaus Copernicus University, Grudziadzka 5, 87-100 Torun, Poland
31
Nicolaus Copernicus Astronomical Center, Polish Academy of Sciences, ul. Bartycka 18, 00-716 Warsaw, Poland
32
Department of Physics and Astronomy, The University of Leicester, University Road, Leicester LE1 7RH, UK
33
GRAPPA, Anton Pannekoek Institute for Astronomy, University of Amsterdam, Science Park 904, 1098 XH Amsterdam, The Netherlands
34
Yerevan Physics Institute, 2 Alikhanian Brothers St., 0036 Yerevan, Armenia
35
Department of Physics, Konan University, 8-9-1 Okamoto, Higashinada, Kobe, Hyogo 658-8501, Japan
36
Kavli Institute for the Physics and Mathematics of the Universe (WPI), The University of Tokyo Institutes for Advanced Study (UTIAS), The University of Tokyo, 5-1-5 Kashiwa-no-Ha, Kashiwa, Chiba 277-8583, Japan
Received:
25
September
2023
Accepted:
26
December
2023
Abstract
Most γ-ray detected active galactic nuclei are blazars with one of their relativistic jets pointing towards the Earth. Only a few objects belong to the class of radio galaxies or misaligned blazars. Here, we investigate the nature of the object PKS 0625−354, its γ-ray flux and spectral variability and its broad-band spectral emission with observations from H.E.S.S., Fermi-LAT, Swift-XRT, and UVOT taken in November 2018. The H.E.S.S. light curve above 200 GeV shows an outburst in the first night of observations followed by a declining flux with a halving time scale of 5.9 h. The γγ-opacity constrains the upper limit of the angle between the jet and the line of sight to ∼10°. The broad-band spectral energy distribution shows two humps and can be well fitted with a single-zone synchrotron self Compton emission model. We conclude that PKS 0625−354, as an object showing clear features of both blazars and radio galaxies, can be classified as an intermediate active galactic nuclei. Multi-wavelength studies of such intermediate objects exhibiting features of both blazars and radio galaxies are sparse but crucial for the understanding of the broad-band emission of γ-ray detected active galactic nuclei in general.
Key words: galaxies: active / galaxies: individual: PKS 0625–354 / galaxies: jets / gamma rays: galaxies
Corresponding authors: e-mail: This email address is being protected from spambots. You need JavaScript enabled to view it. .
© The Authors 2024
 Open Access article, published by EDP Sciences, under the terms of the Creative Commons Attribution License (https://creativecommons.org/licenses/by/4.0), which permits unrestricted use, distribution, and reproduction in any medium, provided the original work is properly cited.
This article is published in open access under the Subscribe to Open model. This email address is being protected from spambots. You need JavaScript enabled to view it. to support open access publication.
1. Introduction
An active galactic nucleus (AGN) is believed to host a supermassive black hole in its center which is surrounded by an accretion disc, fast and slow-moving clouds (corresponding to broad- and narrow-line regions), and a dusty torus. In the very high energy (VHE, E > 100 GeV) γ-ray range, about 80 active galactic nuclei have been detected so far1. In radio-loud AGNs, a pair of plasma jets extend perpendicular to the accretion disc. Most of these objects discovered in the γ-ray regime fall into the class of blazars. They are characterized by strong variability in all energy bands and from sub-day up to year-long time scales (e.g. Wagner & Witzel 1995; Aharonian et al. 2007). According to the unified model of radio-loud AGN (Urry & Padovani 1995), blazars are AGNs that are viewed under a small angle between the jet axis and the line of sight. Hence, strong Doppler beaming is expected to play an important role in the explanation of the properties. In contrast, radio galaxies are viewed under a larger angle to the jet axis. The Doppler factor, defined as δ = [Γ(1 − β cos θ)]−1, where  , is the Lorentz factor, β the velocity of the jet in units of the speed of light and θ the jet viewing angle, is smaller compared to blazars.
Currently, key topics in AGN research are the connection between the jet and the black hole, the jet base, the acceleration and radiation physics in the jet, and the origin and location of the high-energy emission. Measuring the emission of AGN up to the VHE regime is essential for investigations of the underlying physical processes. Among extragalactic TeV γ-ray emitting sources, only a few belong to the class of radio galaxies. These are Centaurus A (Aharonian et al. 2009), M 87 (Aharonian et al. 2003), NGC 1275 (Aleksić et al. 2012), and 3C 264 (Archer et al. 2020). The small number of these objects can be understood in terms of the Doppler boosting effect. The emission of the blazars gets strongly boosted by a high Doppler factor so that the flux and the energy of the γ rays get amplified leading to a higher detection probability. For misaligned jets, due to a larger angle, this amplification is only moderate. Only a few misaligned blazars have been detected. The active galaxies IC 310 (Aleksić et al. 2010) and PKS 0625−354 (H.E.S.S. Collaboration 2018), are showing characteristics of both AGN types.
PKS 0625−354 is a Fanaroff–Riley (FR, Fanaroff & Riley 1974) type I radio galaxy (Ojha et al. 2010), located at a redshift of z = 0.056 (Lauer et al. 2014), and its host galaxy is classified as a low-ionization nuclear emission-line region (LINER, Lewis et al. 2003). While the optical spectrum is that of a BL Lac object (Wills et al. 2004), the kpc radio morphology clearly shows two extended lobe structures typical for a radio galaxy (Angioni et al. 2019). Radio observations revealed superluminal motion with vapp ≈ (2.9 ± 0.9) c (Angioni et al. 2019). The jet-to-counterjet ratio of the pc-scale radio jet limits the viewing angle to θ < 53°, which includes the possibility of an intermediate jet orientation between the radio galaxy and blazar classes (Angioni et al. 2019).
H.E.S.S. reported on the detection of PKS 0625−354 in the VHE γ-ray band based on 5.5 h of good-quality data collected in 2012 (H.E.S.S. Collaboration 2018). The observed TeV gamma-ray photon spectral index of the object is consistent with a simple power-law index of 2.8 ± 0.5 (without correction for absorption due to the extragalactic background light). The flux measured by H.E.S.S. above 580 GeV is ∼4% of the Crab Nebula flux. No VHE γ-ray variability was found by H.E.S.S. Collaboration (2018). Taking into account the redshift of the galaxy, it is among those with the brightest absolute luminosities from the VHE-detected non-blazar objects.
In this paper we present the results from H.E.S.S. observations of PKS 0625−354 as part of the first ever dedicated multi-wavelength campaign including Swift-UVOT (optical/UV), Swift-XRT (X-ray), and Fermi-LAT (γ-ray) measurements conducted in November 2018 (in Sect. 2). In Sect. 3, we discuss the flux variability in the VHE γ-ray band and the simultaneous broad-band spectral energy distribution.
2. Observations and results
2.1. VHE γ-ray observations and analysis
H.E.S.S. (High Energy Stereoscopic System) is an array of five Imaging Air Cherenkov Telescopes located in the Khomas Highland of Namibia at an altitude of about 1800 m a.s.l. Four telescopes with 12 m in diameter are arranged in a square with a side length of 120 m, and a larger 28 m mirror dish diameter is placed in the center of the square (CT5 hereafter). Each telescope measures the Cherenkov light produced in air showers caused by the interaction of γ rays or cosmic rays in the atmosphere of the Earth. Images of the showers are used to determine if they originate from γ-rays or hadrons, as well as to reconstruct the arrival direction and the energy.
In November 2018, PKS 0625−354 was observed by the full array in which events are triggered by CT5 and at least two of the smaller telescopes. The observation started on November 1, 2018 (MJD 58424.01) as part of a program to search for the TeV flux variability of PKS 0625−354. The real-time analysis running in parallel to the observation (Balzer et al. 2014) indicated a significant detection of the target (∼5σ). Therefore, further observations were scheduled and performed in the following nights until MJD 58433 resulting in a total of 17.5 h of live time. The wobble mode was used for the observation where the source position is offset by 0.7° in right ascension or declination from the camera center. This allows simultaneous measurement of the background (Berge et al. 2007).
The data were analyzed using a template-based analysis technique (Parsons & Hinton 2014; Parsons et al. 2015). The background produced by cosmic rays is rejected using a neural network-based scheme. The residual background contamination level of the source region is estimated with the ring background method for the maps and the reflected background method for the reconstruction of the spectrum and light curve (Berge et al. 2007). The background normalization factor is denoted with αExp = ExposureON/ExposureOFF with ON and OFF referring to the signal and the background, respectively. Differential and integral upper limits are derived following Rolke et al. (2005) at the 95% confidence level. An independent analysis chain (de Naurois & Rolland 2009) was used for the calibration and reconstruction as a crosscheck, which yielded compatible results.
The ring background method results in the detection of 771 ON and 16881 OFF events (αExp = 0.0326) yielding a significance of 8.7σ. The reflected background method resulted in 771 ON and 12701 OFF events (αExp = 0.0435), and 8.6σ of significance.
The reported results of the flux measurements, spectra, and upper limits include only statistical errors. For the systematic errors, we conservatively estimated an uncertainty of 20% on the flux normalization and 0.1 on the photon spectral index (Aharonian et al. 2006).
The light curve of the nightly integrated flux above 200 GeV measured between 2018 November 1 (MJD 58423.99) and 2018 November 10 (MJD 58432.99) is shown in Fig. 1. It was calculated assuming a photon spectral index of Γ = 3.0 (dN/dE ∝ E−Γ) similar to the value found in H.E.S.S. Collaboration (2018). Fluxes as well as integral upper limits of individual nights are given in Table 1.
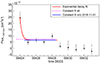 |
Fig. 1. Nightly-binned light curve above 200 GeV measured with the H.E.S.S. telescopes in November 2018 (black data points). Integrated upper limits (gray arrows) are given at a 95% confidence level. The red solid line shows the exponential fit to the measured flux points excluding upper limits, while the pink dashed line shows a constant fit to those flux points, and the blue solid line is the constant fit to those points except the first night. |
H.E.S.S. γ-ray flux measurements above 200 GeV from individual observation nights.
We note here that PKS 0625−354 was also observed with H.E.S.S. in 2019. However, 6.5 h of good-quality data collected during this period of MJD 58579 and MJD 58782−58793, resulted in no detection of the source, yielding only a flux upper limit I(> 200 GeV) < 5 × 10⁻¹² cm−2 s−1.
In this section, we investigate the flux variability in the nightly-binned light curve. The study with smaller time bins showed a constant flux within one observation night for all nights. As no H.E.S.S. observations of PKS 0625−354 were performed in the weeks before 2018-11-01, we cannot make a statement about the start or the duration of the flare.
Fitting all points with significance > 2σ in the light curve with a constant function yields a χ2 of 18.4 for 4 degrees of freedom (d.o.f.) corresponding to a χ2-probability of 1 × 10⁻³. Excluding the data from the first observation night (2018-11-01) improves the fit probability to 0.3.
In order to quantify the variability we estimate the time scale in which the flux changed, by fitting the light curve with an exponential decay function (Rani et al. 2013; Baghmanyan et al. 2017; Gasparyan et al. 2018):
 (1)
(1)
Here, Fb is the baseline flux, F1 the normalization flux at the time t1, and τ is the flux variability time-scale. Fitting the nightly-binned flux points excluding the nights with low (< 2σ) significance with Eq. (1) yields a flux variability time-scale of τ = (5.9 ± 2.7) h and Fb = (6.6 ± 0.9)×10−12 cm−2 s−1 with a χ2/d.o.f. of 4.2/3 corresponding to a χ2-probability of 0.2. The fit is shown in Fig. 1. A different approach is used following, for example, Foschini et al. (2013), Brown (2013), Coogan et al. (2016),
 (2)
(2)
where F(t1) and F(t0) are two flux measurements of consecutive nights t0t1 and τH indicates the flux halving time-scale. The most significant flux change of 3.5σ is found between the first and the second observation night resulting in a flux halving time-scale of τ = (10.3 ± 6.9) h. We note that there is no clear indication of exponential decay in the data. Also, we do not know the starting point of the high flux state. For the rest of this work, we use τ = (5.9 ± 2.7) h as variability time-scale even though it can be only considered as an upper limit.
Spectral energy distributions are shown in Fig. 2 and results of the spectral fits are given in Table 2. They are described by a power-law function:
 (3)
(3)
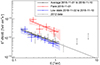 |
Fig. 2. Spectral energy distributions measured with the H.E.S.S. telescopes in 2018 and 2012. The averaged spectrum is shown with black points/butterfly and a black fit line. The red data points, butterfly and the red line indicate the spectrum measured on 2018-11-01, while the data points/butterfly and the line in blue shows the spectrum computed from the remaining data taken in November 2018. For comparison, we show the results obtained in 2012 in gray (H.E.S.S. Collaboration 2018). |
Results of power-law fit of the spectra measured with H.E.S.S.
where f0 is the normalization at the energy E0 and ΓVHE is the photon spectral index. We calculate an averaged spectrum of all data in order to compare it with the results obtained from the 2012 measurements (H.E.S.S. Collaboration 2018). Furthermore, we compute a spectrum of the data from the night with the highest flux (2018-11-01) and one for the remaining data to study possible spectral index variations.
2.2. HE γ-ray observations and analysis
High energy γ-ray observations of PKS 0625−354 (4FGL J0627.0−3529) were performed with the Fermi-LAT detector. The data collected in the energy range from 100 MeV to 500 GeV were analyzed using standard ScienceTools with P8R3_SOURCE_V3 instrument response function. For the analysis, events within a 10° region of interest (ROI) centered on the source were selected. The binned maximum-likelihood method (Mattox et al. 1996) was applied in the analysis, with the Galactic diffuse background modeled using the gll_iem_v06 map cube. All sources from the Fermi-LAT Third Source Catalog (4FGL, Abdollahi et al. 2020) inside the ROI of PKS 0625−354 were modeled.
Two time intervals were selected for the spectral analysis: one overlapping with the H.E.S.S. flaring state (MJD 58421−58425), and one representing the H.E.S.S. low state period (MJD 58424−58433). The flaring state mentioned here includes data centered on the flux maximum measured with H.E.S.S. and observations performed just before and after the H.E.S.S. flare. The low state corresponds to the period after the H.E.S.S. flare and includes all of the consecutive VHE observations performed just after the flare. The two intervals selected for the Fermi-LAT spectra have a small overlap. Such a selection of the low-state Fermi-LAT spectrum allows us, however, to have exactly the same periods covered by the VHE and HE γ-ray observations and cover the simultaneous X-ray observations as well. The spectral reconstruction of the Fermi-LAT low state is not affected if the time selection is shifted by 24 h to avoid overlap with the high state.
In the case of the flaring state, the analysis performed resulted in a test statistic (TS) of 11.2, while for the low state a TS = 9.5 is found. The flaring and low state are both well described by power-law spectra with a photon index of 2.15 ± 0.36 and 2.08 ± 0.31, and a normalization of (1.44 ± 0.93) × 10−12 MeV s−1 cm−2 and (0.62 ± 0.35) × 10−12 MeV s−1 cm−2, respectively.
A corresponding butterfly is calculated for both cases and included in the broad-band spectral energy distribution presented in Fig. 3. A more detailed (binned) spectral and light curve analysis from of November 2018 is not reliable with the limited statistics. Furthermore, a statement about potential spectral variation from the long-term spectrum is also inconclusive. Within the uncertainties the spectral indices agree with the long-term measurement. A long-term light curve analysis over the entire year of 2018 is shown in Fig. 4. A constant fit to the light curve yields a χ2/d.o.f. of 31.3/8 corresponding to a probability of 1.2 × 10⁻⁴. Interestingly, the highest flux point is found in November 2018.
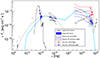 |
Fig. 3. Broad-band spectral energy distribution of PKS 0625−354 including (quasi-) simultaneous data (colored) as well as archival measurements shown with gray data points. The H.E.S.S. data points were corrected for EBL absorption using the model by Domínguez et al. (2011). The red data points indicate the TeV high state on 2018-11-01. The blue data points were obtained during a TeV low state after 2018-11-01. The red and blue unfilled butterflies are results from Fermi-LAT measurements as described in Sect. 2.2. The light blue line shows the model obtained with a single-zone SSC code from Krawczynski et al. (2004). The dashed gray line is a log-parabola fit to Tanami data, the high frequency UVOT and the XRT data in order to identify the location of the first SED maximum and its amplitude. Archival measurements from H.E.S.S. Collaboration (2018), best fits of historical X-ray measurements (gray lines, as provided by H.E.S.S. Collaboration 2018), and Angioni et al. (2019) are included. For the historical X-ray results, we show only the best fit functions. The black line indicates the host galaxy flux model as presented in H.E.S.S. Collaboration (2018). |
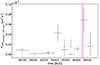 |
Fig. 4. Light curve and flux upper limits measured with Fermi-LAT in 2018 between 100 MeV and 500 GeV. A two-month binning is chosen for the first half of the year 2018 and a monthly binning for the second half of the year. The magenta area shows the time when H.E.S.S. observations took place. |
2.3. X-ray observations and analysis
Swift-XRT observations of PKS 0625−354 in 2018 were carried out on November 3, 4, and 5, for 1988 s, 2149 s, and 1895 s, respectively. All observations, corresponding to the ObsIDs of 00088133003–00088133005, were performed in the photon counting mode (PC) in the energy range of 0.3−10 keV.
The data analysis was performed using the HEASOFT software (version 6.29). Data were recalibrated using the standard xrtpipeline procedure. For the spectral fitting xspec was used (Arnaud 1996).
All data were binned to have at least 30 counts per bin. Energy fluxes have been derived by fitting each single observation with a single power-law model with a Galactic absorption value of NH = 6.5 × 1020 cm−2 (LAB survey, Kalberla et al. 2005). Fit parameters of the spectral analysis of the X-ray observations are included in Table 3. The butterfly of the spectral analysis of the total data set is shown in Fig. 3.
Swift-XRT X-ray spectral measurements from observations in November 2018.
2.4. Optical and ultraviolet observations and analysis
Simultaneous optical and ultraviolet observations in six bands were performed with Swift-UVOT: V (544 nm), B (439 nm), U (345 nm), UVW1 (251 nm), UVM2 (217 nm) and UVW2 (188 nm). In the case of each of these observations, for the analysis, all photons in a circular region with a radius of 5 arcsec were taken into account. The background was determined also from a circular region located near the source region but in an area not contaminated by signals from nearby sources. The instrumental magnitudes and the corresponding fluxes were calculated with the uvotsource task. The conversion into flux units was done using the factors from Poole et al. (2008). The measured fluxes were corrected for the dust absorption using E(B − V) = 0.0562 mag (Schlafly & Finkbeiner 2011) and Aλ/E(B − V), as provided by Giommi et al. (2006). All Swift-UVOT measurements are listed in Table 4 and shown in Fig. 3.
Swift-UVOT fluxes for different observations, corrected for the Galactic extinction.
3. Discussion
3.1. Implications from fast VHE γ-ray variability
For this discussion we assume that the VHE emission originates from a spherical region with a radius R at a redshift z. Due to causality argument, R can be constrained by the variability time scale τ following
 (4)
(4)
where δ is the Doppler factor and c is the speed of light. For τ = (5.9 ± 2.7) h and z = 0.056, this yields R ≤ δ × 6.0 × 1014 cm. The mass of the central supermassive black hole in PKS 0625−354 is estimated to be 109.19 ± 0.37 M⊙ (Bettoni et al. 2003), corresponding to ∼2.1 h for the event horizon light crossing time2, which is smaller than the observed variability time scale.
For a small emission region as estimated from the fast variability time scale, it is necessary to investigate if possible internal absorption via γγ-pair production takes place. For this we estimate the optical depth for pair production using Eq. (9) in Abdo et al. (2011) based on Dondi & Ghisellini (1995):
 (5)
(5)
where σT is the Thomson cross section, me is the electron mass, and DL is the luminosity distance. For 1 TeV photons (ϵγ = 1 TeV in this case) and therefore, to significantly reduce pair production, τγγ needs to be < 1 (for τγγ = 1 the flux is reduced by 1/e). Taking the observed (though not simultaneous and not corrected for host galaxy emission) value from the 2MASS survey in the H-band F2MASS, H = (1.67 ± 0.13)×10−11 erg cm−2 s−1 (Skrutskie et al. 2006) for F0 where the absorption of the TeV photons is supposed to happen, this yields a constraint for the Doppler factor of δ > (6.7 ± 0.5)3. Notably, the value of δ is robust to uncertainties in R and F0 as according to Eq. (5) δ only depends weakly on these parameters, δ ∝ (F0/R)(1/5).
Assuming that the γ-ray emission originates from a single zone, the constraint for the Doppler factor implies that viewing angles larger than ∼10° can be excluded for PKS 0625−354 for any values of the bulk Lorentz factor (see Fig. 5). This is a stronger constraint than the limit obtained from very-long baseline interferometry observations in the radio band (Angioni et al. 2019). Furthermore, if the viewing angle is not small (θ > 5°) as suggested by the large scale radio morphology, then a small Lorentz factor (for example Γj = 5) provides a higher Doppler boosting. Instead, assuming a larger bulk Lorentz factor for the same viewing angle already results in a smaller Doppler boosting.
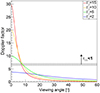 |
Fig. 5. Doppler factor as function of viewing angle plotted for different bulk Lorentz factors (red Γj = 15, yellow Γj = 10, green Γj = 5, and blue Γj = 2). The ranges of Doppler factors for which the optical depth for γγ-pair production constrained by the variability time scale is smaller than 1 is indicated with the black box and the arrow. |
3.2. Broad-band spectral energy distribution
The spectral energy distribution (SED) of a radio-loud AGN can be explained by non-thermal emission of particles accelerated at shock waves in the jet resulting from plasma density fluctuations (Blandford & Königl 1979). Generally, two peaks are measured. The low energy part of the SED is explained by synchrotron radiation of electrons and positrons. The origin of the high energy hump is widely discussed in the literature. It has been modeled with leptonic processes, i.e., inverse-Compton scattering (Marscher & Gear 1985; Maraschi et al. 1992; Dermer et al. 1992) or alternatively with hadronic processes, for example, pion decay or proton synchrotron (Mannheim 1993a,b; Mücke et al. 2003; Aharonian 2000).
We will apply a simple leptonic one-zone synchrotron-self Compton (SSC) model to the broad-band SED (Krawczynski et al. 2004). The parameters of the model are: the bulk Lorentz factor Γj, the viewing angle θ, the magnetic field B, the radius of the emission region R, the energy density of electrons Ue, the ratio η of Ue to the magnetic field energy density UB, the minimal and maximal electron energy Emin and Emax, and the break energy Ebreak. The electrons are assumed to follow a power-law energy spectrum of the form of dN/dE ∝ E−pi (E electron energy in the jet frame) with index p1 for Emin < E < Ebreak and p2 for Ebreak < E < Emax. The host galaxy emission dominates in the optical and part of the UV range. Following H.E.S.S. Collaboration (2018) the host galaxy emission is included in these energy ranges, by simulating the emission of a giant elliptical galaxy with the PEGASE 2 templates (Fioc & Rocca-Volmerange 1999).
For the SED modeling, we used only the data that were taken contemporaneously to the H.E.S.S. observations (blue points in Fig. 3), excluding the data from 2018-11-01 (red points in Fig. 3). As presented in this work, no significant multi-wavelength flux variations are found in the time range of 2018-11-02 to 2018-11-10 apart from the VHE flux changes. We assumed a small Lorentz factor of Γj = 5 and a small viewing angle of θ = 8° which results in a moderate boosting of δ = 6.7. Furthermore, we used a radius of R = 6.0 × 1014 cm. Three of these assumed parameters, Γj, δ, and R, also marked with an asterisk in Table 5, result from variability constraints discussed in Sect. 3.1 whereas θ is derived from the Lorentz and Doppler factor constraints. We note that the value assumed for R is comparable to radius estimates for the blazar Mrk 421 at various time periods (Mankuzhiyil et al. 2011), but an order of magnitude smaller than for other TeV detected BL Lacertae-type objects (Tavecchio et al. 2010; Mankuzhiyil et al. 2012) which typically showed VHE variability on longer time-scales as presented here for PKS 0625−354. Also Fukazawa et al. (2015) found values of R one or two orders of magnitude larger for PKS 0625−354 for a five-year time period of Fermi-LAT data including a moderate flare in HE with a longer variability time scale. The absorption by the extragalactic background light (EBL) is taken into account in the SED with EBL-corrected VHE data points using the model by Domínguez et al. (2011). The SED model presented here is only one possibility out of a large number of models suitable to explain the multi-wavelength data. The parameters have been chosen to reproduce the shape of the lower energy component of the SED, especially the Swift-XRT data, and simultaneously to fit the high energy data points from Fermi-LAT and H.E.S.S. The SED as well as the model are shown in Fig. 3. The individual model parameters are given in Table 5. The resulting value for the B-field is rather high, but still consistent with values found by Mankuzhiyil et al. (2011), Tavecchio et al. (2010), and Ghisellini et al. (2011). A comparison of the parameter results presented in this work for PKS 0625−354 with SSC model parameter results from other misaligned objects is difficult because the sample of broad-band SEDs from misaligned objects based on simultaneous multiwavelength observations is very low. Moreover, comparing, for example, the results of R for PKS 0625−354 with SEDs of VHE detected BL Lacertae-type objects is difficult because sufficiently covered SEDs for BL Lacertae-type objects on a broad frequency range are typically based on time periods where the objects are not variable or variable on longer time periods in VHE.
Model parameters for the one-zone SSC model SED of PKS 0625−354 (z = 0.056).
The SED presented here shows that the simple one-zone SSC model can fit the data reasonably well, similar to the results from Fukazawa et al. (2015), where only contemporaneous X-ray and long-term Fermi-LAT data were considered for the modeling. In contrast, the modeling by H.E.S.S. Collaboration (2018) indicated difficulties when using a simple SSC model based on contemporaneous data in the optical/UV, HE (long-term), and VHE data. In this work we are able to consider nearly simultaneous optical/UV, X-ray, HE, and VHE data for the first time.
In terms of the energy parameters of the electrons, Emin and Emax, presented in this work, the model is similar to what is typically found for high-frequency peaked BL Lacertae-type objects (HBL) with a rather hard particle distribution, for example, H.E.S.S. Collaboration (2013), Aliu et al. (2013), Aleksić et al. (2014, 2015), and Abdalla et al. (2019). Assuming that the break in the electron distribution is is the cooling break, resulting from an equilibrium between injection, radiative (synchrotron and inverse Compton) cooling, and escape, a spectral index of the injected electron distribution of 2.2 is required. Furthermore, the model is Compton-dominated, which is commonly observed for low frequency peaked BL Lacertae-type objects and Flat Spectrum Radio Quasars (Fossati et al. 1998; Prandini & Ghisellini 2022).
Despite the limited statistics in the Fermi-band – considering the break between the long-term Fermi data and the spectrum obtained with H.E.S.S. – that flux level is comparable to the synchrotron peak. These findings show the very diverse characteristics of PKS 0625−354 making a final classification of this object difficult.
Previously, Keenan et al. (2021) presented a study of the synchrotron peak luminosity versus peak frequency plane and the dependence of the location in this plane on the jet power based on a large sample of AGNs. They discussed also the influence of velocity gradients of jets and the effect of misalignment and highlighted that all radio galaxies, except for 3C 264 (independent of their power) appear at low synchrotron peak frequencies. In this work, we included PKS 0625−354 (see Fig. 6) and further highlight TeV detected radio galaxies or misaligned blazars. The paucity of multiwavelength data from PKS 0625−354 is likely the reason why this object was not included by Keenan et al. (2021). With the observation campaign in November 2018, presented in this paper the multiwavelength information is now improved, and thus we can estimate where PKS 0625−354 is located in synchrotron the peak frequency – peak luminosity plane. Based on our broad-band spectral energy distribution we applied a simple log-parabolic fit to the Tanami data4 from Angioni et al. (2019), the high frequency UVOT data (which are less affected by the host galaxy emission) and XRT data, see Fig. 3. The resulting peak frequency of 1.2 × 10¹⁶ Hz and its amplitude corresponding to 3.5 × 1043 erg s−1 are shown in Fig. 6. Similar to 3C 264, PKS 0625−354 could represent a slightly less-beamed low-power jet with a significant velocity gradient along the jet axis (Georganopoulos & Kazanas 2003) based on the location in the plane. The velocity gradient is consistent with a low bulk Lorentz factor in order to obtain a rather large Doppler boosting in misaligned jets, which is needed to explain the fast TeV variability. The log-parabolic fit includes radio observations that are not simultaneous or contemporaneous to the UVOT and XRT data. Excluding the radio data in the fit results in a peak frequency of 1.9 × 10¹⁵ Hz and a synchrotron peak luminosity of 3.2 × 1043 erg s−1, i.e., at about the same luminosity, but around one order of magnitude lower in frequency. This result does not affect the discussion and conclusions in this section.
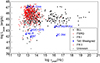 |
Fig. 6. Synchrotron peak luminosity versus peak frequency as shown in Keenan et al. (2021). BL Lacertae-type type objects are indicated with black filled circles while flat spectrum radio quasars are shown with red triangles. FR I and FR II radio galaxies are shown with black open circles and red open triangles, respectively. Objects of unknown type are plotted with gray squares. We highlight all TeV detected misaligned objects and included PKS 0625−354 from this work (the object IC 310 is not included in this figure due to an unknown peak frequency and peak luminosity). |
4. Conclusions
Simultaneous multi-wavelength observations and the investigation of the broad-band spectral energy distribution of non-blazar objects is an important tool to understand the γ-ray emission of AGNs in general. PKS 0625−354 is one of only a few objects detected up to TeV energies, but no simultaneous optical/UV, X-ray, HE, and VHE observation campaign was performed before.
In this paper, we present multi-wavelength observations of PKS 0625−354 conducted in November 2018. The light curve obtained with the H.E.S.S. telescopes revealed an outburst on November 1, 2018 followed by a decrease of the flux that can be described by an exponential decay with a flux halving time scale of (5.9 ± 2.7) h. Unfortunately, there are no VHE observations covering the beginning of the outburst.
The VHE photon spectral index is consistent within the errors with the low-state spectrum and with the spectrum measured in 2012. The fast variability and the γγ pair production limits the viewing angle to ∼10°, which is smaller than the upper limit obtained for this object from high-resolution radio measurements. Using Swift-UVOT and -XRT data as well as Fermi-LAT measurements together with the H.E.S.S. results we reconstructed a simultaneous broad-band SED and fit this with a single-zone SSC model different to that presented in H.E.S.S. Collaboration (2018), where the X-ray and γ-ray data were non-simultaneous.
The diverse multi-wavelength behavior of the object by showing one typical AGN-type characteristic in one frequency band and showing a different picture in another band – for example, extended radio emission versus a typical BL Lacertae-type type optical spectrum and variable gamma-ray emission – places PKS 0625−354 at the borderline between different classes. It is likely that this is caused by a viewing angle that is too large to be a blazar and too small to be a typical radio galaxy. In principle, assuming the unified model of AGN, jet viewing angles should be randomly distributed in the universe, thus borderline objects must exist. Studying such individual objects is essential because they provide important constraints on acceleration and emission models such as the size and the location of the gamma-ray emission region. They often challenge the current understanding of the standard models for (high-energy) emission, for example, with flux variability, and thus they can help us to understand the physical processes in AGN jets in general.
We calculated the event horizon light crossing time assuming a maximally rotating black hole (Kerr metric), thus GMBH/c3.
Reducing the assumed H-band flux down to 10% of its value as suggested by the SSC modeling in Sect. 3.2 (approximately the host-galaxy corrected value), results in a Doppler factor of δ > (4.6 ± 0.7).
We only include Tanami data in the radio band for the fit because the other radio measurements result from large radio beams that also integrate the steep-spectrum diffusive emission from the extended jet.
Acknowledgments
The support of the Namibian authorities and of the University of Namibia in facilitating the construction and operation of H.E.S.S. is gratefully acknowledged, as is the support by the German Ministry for Education and Research (BMBF), the Max Planck Society, the Helmholtz Association, the French Ministry of Higher Education, Research and Innovation, the Centre National de la Recherche Scientifique (CNRS/IN2P3 and CNRS/INSU), the Commissariat à l’énergie atomique et aux énergies alternatives (CEA), the UK Science and Technology Facilities Council (STFC), the Irish Research Council (IRC) and the Science Foundation Ireland (SFI), the Polish Ministry of Education and Science, agreement no. 2021/WK/06, the South African Department of Science and Innovation and National Research Foundation, the University of Namibia, the National Commission on Research, Science & Technology of Namibia (NCRST), the Austrian Federal Ministry of Education, Science and Research and the Austrian Science Fund (FWF), the Australian Research Council (ARC), the Japan Society for the Promotion of Science, the University of Amsterdam and the Science Committee of Armenia grant 21AG-1C085. We appreciate the excellent work of the technical support staff in Berlin, Zeuthen, Heidelberg, Palaiseau, Paris, Saclay, Tübingen and in Namibia in the construction and operation of the equipment. This work benefited from services provided by the H.E.S.S. Virtual Organisation, supported by the national resource providers of the EGI Federation. This publication makes use of data products from the Two Micron All Sky Survey, which is a joint project of the University of Massachusetts and the Infrared Processing and Analysis Center/California Institute of Technology, funded by the National Aeronautics and Space Administration and the National Science Foundation.
References
- Abdalla, H., Aharonian, F., Ait Benkhali, F., et al. 2019, MNRAS, 482, 3011 [Google Scholar]
- Abdo, A. A., Ackermann, M., Ajello, M., et al. 2011, ApJ, 727, 129 [NASA ADS] [CrossRef] [Google Scholar]
- Abdollahi, S., Acero, F., Ackermann, M., et al. 2020, ApJS, 247, 33 [Google Scholar]
- Aharonian, F. A. 2000, New Astron., 5, 377 [NASA ADS] [CrossRef] [Google Scholar]
- Aharonian, F., Akhperjanian, A., Beilicke, M., et al. 2003, A&A, 403, L1 [NASA ADS] [CrossRef] [EDP Sciences] [Google Scholar]
- Aharonian, F., Akhperjanian, A. G., Bazer-Bachi, A. R., et al. 2006, A&A, 457, 899 [NASA ADS] [CrossRef] [EDP Sciences] [Google Scholar]
- Aharonian, F., Akhperjanian, A. G., Bazer-Bachi, A. R., et al. 2007, ApJ, 664, L71 [NASA ADS] [CrossRef] [Google Scholar]
- Aharonian, F., Akhperjanian, A. G., Anton, G., et al. 2009, ApJ, 695, L40 [Google Scholar]
- Aleksić, J., Antonelli, L. A., Antoranz, P., et al. 2010, ApJ, 723, L207 [CrossRef] [Google Scholar]
- Aleksić, J., Alvarez, E. A., Antonelli, L. A., et al. 2012, A&A, 539, L2 [NASA ADS] [CrossRef] [EDP Sciences] [Google Scholar]
- Aleksić, J., Ansoldi, S., Antonelli, L. A., et al. 2014, A&A, 567, A135 [NASA ADS] [CrossRef] [EDP Sciences] [Google Scholar]
- Aleksić, J., Ansoldi, S., Antonelli, L. A., et al. 2015, MNRAS, 446, 217 [CrossRef] [Google Scholar]
- Aliu, E., Archambault, S., Arlen, T., et al. 2013, ApJ, 775, 3 [NASA ADS] [CrossRef] [Google Scholar]
- Angioni, R., Ros, E., Kadler, M., et al. 2019, A&A, 627, A148 [NASA ADS] [CrossRef] [EDP Sciences] [Google Scholar]
- Archer, A., Benbow, W., Bird, R., et al. 2020, ApJ, 896, 41 [NASA ADS] [CrossRef] [Google Scholar]
- Arnaud, K. A. 1996, in Astronomical Data Analysis Software and Systems V, eds. G. H. Jacoby, & J. Barnes, ASP Conf. Ser., 101, 17 [NASA ADS] [Google Scholar]
- Baghmanyan, V., Gasparyan, S., & Sahakyan, N. 2017, ApJ, 848, 111 [NASA ADS] [CrossRef] [Google Scholar]
- Balzer, A., Füßling, M., Gajdus, M., et al. 2014, Astropart. Phys., 54, 67 [NASA ADS] [CrossRef] [Google Scholar]
- Berge, D., Funk, S., & Hinton, J. 2007, A&A, 466, 1219 [CrossRef] [EDP Sciences] [Google Scholar]
- Bettoni, D., Falomo, R., Fasano, G., & Govoni, F. 2003, A&A, 399, 869 [NASA ADS] [CrossRef] [EDP Sciences] [Google Scholar]
- Blandford, R. D., & Königl, A. 1979, ApJ, 232, 34 [Google Scholar]
- Brown, A. M. 2013, MNRAS, 431, 824 [Google Scholar]
- Coogan, R. T., Brown, A. M., & Chadwick, P. M. 2016, MNRAS, 458, 354 [NASA ADS] [CrossRef] [Google Scholar]
- de Naurois, M., & Rolland, L. 2009, Astropart. Phys., 32, 231 [Google Scholar]
- Dermer, C. D., Schlickeiser, R., & Mastichiadis, A. 1992, A&A, 256, L27 [NASA ADS] [Google Scholar]
- Domínguez, A., Primack, J. R., Rosario, D. J., et al. 2011, MNRAS, 410, 2556 [Google Scholar]
- Dondi, L., & Ghisellini, G. 1995, MNRAS, 273, 583 [NASA ADS] [Google Scholar]
- Fanaroff, B. L., & Riley, J. M. 1974, MNRAS, 167, 31 [Google Scholar]
- Fioc, M., & Rocca-Volmerange, B. 1999, arXiv e-prints [arXiv:astro-ph/9912179] [Google Scholar]
- Foschini, L., Bonnoli, G., Ghisellini, G., et al. 2013, A&A, 555, A138 [NASA ADS] [CrossRef] [EDP Sciences] [Google Scholar]
- Fossati, G., Maraschi, L., Celotti, A., Comastri, A., & Ghisellini, G. 1998, MNRAS, 299, 433 [Google Scholar]
- Fukazawa, Y., Finke, J., Stawarz, Ł., et al. 2015, ApJ, 798, 74 [Google Scholar]
- Gasparyan, S., Sahakyan, N., Baghmanyan, V., & Zargaryan, D. 2018, ApJ, 863, 114 [NASA ADS] [CrossRef] [Google Scholar]
- Georganopoulos, M., & Kazanas, D. 2003, ApJ, 594, L27 [NASA ADS] [CrossRef] [Google Scholar]
- Ghisellini, G., Tavecchio, F., Foschini, L., & Ghirlanda, G. 2011, MNRAS, 414, 2674 [NASA ADS] [CrossRef] [Google Scholar]
- Giommi, P., Blustin, A. J., Capalbi, M., et al. 2006, A&A, 456, 911 [NASA ADS] [CrossRef] [EDP Sciences] [Google Scholar]
- H.E.S.S. Collaboration (Abramowski, A., et al.) 2013, A&A, 559, A136 [NASA ADS] [CrossRef] [EDP Sciences] [Google Scholar]
- H.E.S.S. Collaboration (Abdalla, H., et al.) 2018, MNRAS, 476, 4187 [NASA ADS] [CrossRef] [Google Scholar]
- Kalberla, P. M. W., Burton, W. B., Hartmann, D., et al. 2005, A&A, 440, 775 [NASA ADS] [CrossRef] [EDP Sciences] [Google Scholar]
- Keenan, M., Meyer, E. T., Georganopoulos, M., Reddy, K., & French, O. J. 2021, MNRAS, 505, 4726 [NASA ADS] [CrossRef] [Google Scholar]
- Krawczynski, H., Hughes, S. B., Horan, D., et al. 2004, ApJ, 601, 151 [NASA ADS] [CrossRef] [Google Scholar]
- Lauer, T. R., Postman, M., Strauss, M. A., Graves, G. J., & Chisari, N. E. 2014, ApJ, 797, 82 [Google Scholar]
- Lewis, K. T., Eracleous, M., & Sambruna, R. M. 2003, ApJ, 593, 115 [NASA ADS] [CrossRef] [Google Scholar]
- Mankuzhiyil, N., Ansoldi, S., Persic, M., & Tavecchio, F. 2011, ApJ, 733, 14 [NASA ADS] [CrossRef] [Google Scholar]
- Mankuzhiyil, N., Ansoldi, S., Persic, M., et al. 2012, ApJ, 753, 154 [NASA ADS] [CrossRef] [Google Scholar]
- Mannheim, K. 1993a, A&A, 269, 67 [NASA ADS] [Google Scholar]
- Mannheim, K. 1993b, Phys. Rev. D, 48, 2408 [NASA ADS] [CrossRef] [Google Scholar]
- Maraschi, L., Ghisellini, G., & Celotti, A. 1992, ApJ, 397, L5 [CrossRef] [Google Scholar]
- Marscher, A. P., & Gear, W. K. 1985, ApJ, 298, 114 [Google Scholar]
- Mattox, J. R., Bertsch, D. L., Chiang, J., et al. 1996, ApJ, 461, 396 [Google Scholar]
- Mücke, A., Protheroe, R. J., Engel, R., Rachen, J. P., & Stanev, T. 2003, Astropart. Phys., 18, 593 [Google Scholar]
- Ojha, R., Kadler, M., Böck, M., et al. 2010, A&A, 519, A45 [NASA ADS] [CrossRef] [EDP Sciences] [Google Scholar]
- Parsons, R. D., & Hinton, J. A. 2014, Astropart. Phys., 56, 26 [Google Scholar]
- Parsons, R., Murach, T., & Gajdus, M. 2015, Int. Cosm. Ray Conf., 34, 826 [NASA ADS] [Google Scholar]
- Poole, T. S., Breeveld, A. A., Page, M. J., et al. 2008, MNRAS, 383, 627 [Google Scholar]
- Prandini, E., & Ghisellini, G. 2022, Galaxies, 10, 35 [NASA ADS] [CrossRef] [Google Scholar]
- Rani, B., Lott, B., Krichbaum, T. P., Fuhrmann, L., & Zensus, J. A. 2013, A&A, 557, A71 [NASA ADS] [CrossRef] [EDP Sciences] [Google Scholar]
- Rolke, W. A., López, A. M., & Conrad, J. 2005, Nucl. Instrum. Meth. Phys. Res. A, 551, 493 [Google Scholar]
- Schlafly, E. F., & Finkbeiner, D. P. 2011, ApJ, 737, 103 [Google Scholar]
- Skrutskie, M. F., Cutri, R. M., Stiening, R., et al. 2006, AJ, 131, 1163 [NASA ADS] [CrossRef] [Google Scholar]
- Tavecchio, F., Ghisellini, G., Ghirlanda, G., Foschini, L., & Maraschi, L. 2010, MNRAS, 401, 1570 [Google Scholar]
- Urry, C. M., & Padovani, P. 1995, PASP, 107, 803 [NASA ADS] [CrossRef] [Google Scholar]
- Wagner, S. J., & Witzel, A. 1995, ARA&A, 33, 163 [NASA ADS] [CrossRef] [Google Scholar]
- Wills, K. A., Morganti, R., Tadhunter, C. N., Robinson, T. G., & Villar-Martin, M. 2004, MNRAS, 347, 771 [NASA ADS] [CrossRef] [Google Scholar]
All Tables
H.E.S.S. γ-ray flux measurements above 200 GeV from individual observation nights.
Swift-UVOT fluxes for different observations, corrected for the Galactic extinction.
All Figures
|
Fig. 1. Nightly-binned light curve above 200 GeV measured with the H.E.S.S. telescopes in November 2018 (black data points). Integrated upper limits (gray arrows) are given at a 95% confidence level. The red solid line shows the exponential fit to the measured flux points excluding upper limits, while the pink dashed line shows a constant fit to those flux points, and the blue solid line is the constant fit to those points except the first night. |
| In the text | |
|
Fig. 2. Spectral energy distributions measured with the H.E.S.S. telescopes in 2018 and 2012. The averaged spectrum is shown with black points/butterfly and a black fit line. The red data points, butterfly and the red line indicate the spectrum measured on 2018-11-01, while the data points/butterfly and the line in blue shows the spectrum computed from the remaining data taken in November 2018. For comparison, we show the results obtained in 2012 in gray (H.E.S.S. Collaboration 2018). |
| In the text | |
|
Fig. 3. Broad-band spectral energy distribution of PKS 0625−354 including (quasi-) simultaneous data (colored) as well as archival measurements shown with gray data points. The H.E.S.S. data points were corrected for EBL absorption using the model by Domínguez et al. (2011). The red data points indicate the TeV high state on 2018-11-01. The blue data points were obtained during a TeV low state after 2018-11-01. The red and blue unfilled butterflies are results from Fermi-LAT measurements as described in Sect. 2.2. The light blue line shows the model obtained with a single-zone SSC code from Krawczynski et al. (2004). The dashed gray line is a log-parabola fit to Tanami data, the high frequency UVOT and the XRT data in order to identify the location of the first SED maximum and its amplitude. Archival measurements from H.E.S.S. Collaboration (2018), best fits of historical X-ray measurements (gray lines, as provided by H.E.S.S. Collaboration 2018), and Angioni et al. (2019) are included. For the historical X-ray results, we show only the best fit functions. The black line indicates the host galaxy flux model as presented in H.E.S.S. Collaboration (2018). |
| In the text | |
|
Fig. 4. Light curve and flux upper limits measured with Fermi-LAT in 2018 between 100 MeV and 500 GeV. A two-month binning is chosen for the first half of the year 2018 and a monthly binning for the second half of the year. The magenta area shows the time when H.E.S.S. observations took place. |
| In the text | |
|
Fig. 5. Doppler factor as function of viewing angle plotted for different bulk Lorentz factors (red Γj = 15, yellow Γj = 10, green Γj = 5, and blue Γj = 2). The ranges of Doppler factors for which the optical depth for γγ-pair production constrained by the variability time scale is smaller than 1 is indicated with the black box and the arrow. |
| In the text | |
|
Fig. 6. Synchrotron peak luminosity versus peak frequency as shown in Keenan et al. (2021). BL Lacertae-type type objects are indicated with black filled circles while flat spectrum radio quasars are shown with red triangles. FR I and FR II radio galaxies are shown with black open circles and red open triangles, respectively. Objects of unknown type are plotted with gray squares. We highlight all TeV detected misaligned objects and included PKS 0625−354 from this work (the object IC 310 is not included in this figure due to an unknown peak frequency and peak luminosity). |
| In the text | |
Current usage metrics show cumulative count of Article Views (full-text article views including HTML views, PDF and ePub downloads, according to the available data) and Abstracts Views on Vision4Press platform.
Data correspond to usage on the plateform after 2015. The current usage metrics is available 48-96 hours after online publication and is updated daily on week days.
Initial download of the metrics may take a while.