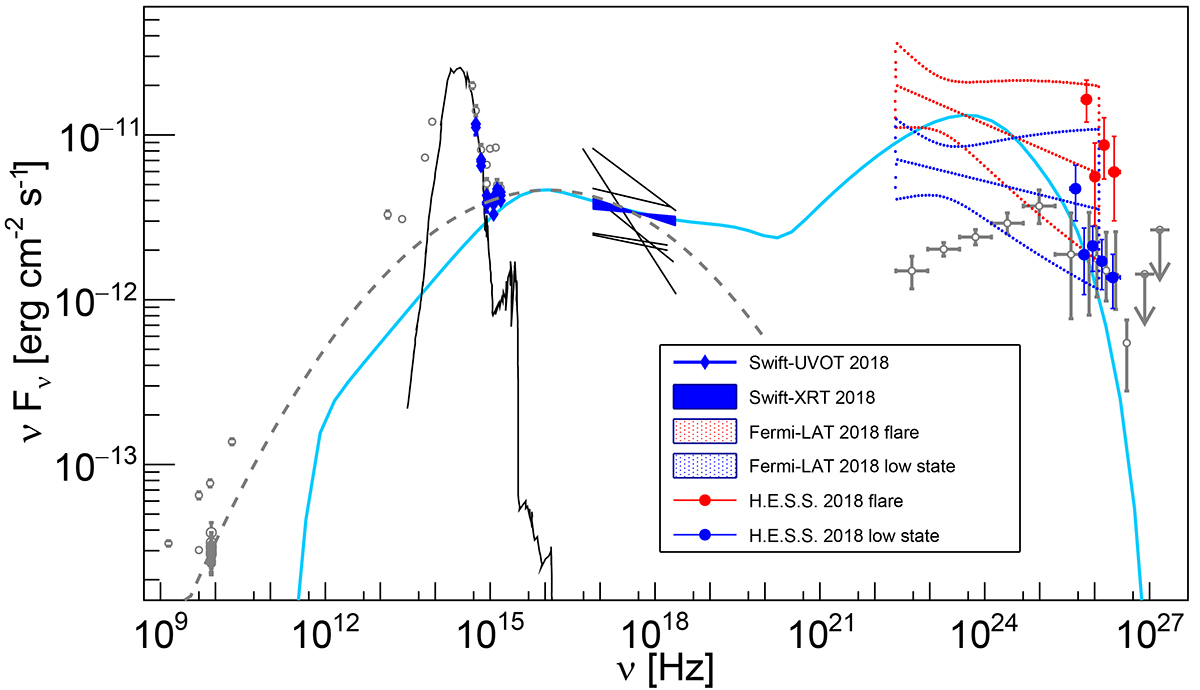
Fig. 3.
Download original image
Broad-band spectral energy distribution of PKS 0625−354 including (quasi-) simultaneous data (colored) as well as archival measurements shown with gray data points. The H.E.S.S. data points were corrected for EBL absorption using the model by Domínguez et al. (2011). The red data points indicate the TeV high state on 2018-11-01. The blue data points were obtained during a TeV low state after 2018-11-01. The red and blue unfilled butterflies are results from Fermi-LAT measurements as described in Sect. 2.2. The light blue line shows the model obtained with a single-zone SSC code from Krawczynski et al. (2004). The dashed gray line is a log-parabola fit to Tanami data, the high frequency UVOT and the XRT data in order to identify the location of the first SED maximum and its amplitude. Archival measurements from H.E.S.S. Collaboration (2018), best fits of historical X-ray measurements (gray lines, as provided by H.E.S.S. Collaboration 2018), and Angioni et al. (2019) are included. For the historical X-ray results, we show only the best fit functions. The black line indicates the host galaxy flux model as presented in H.E.S.S. Collaboration (2018).
Current usage metrics show cumulative count of Article Views (full-text article views including HTML views, PDF and ePub downloads, according to the available data) and Abstracts Views on Vision4Press platform.
Data correspond to usage on the plateform after 2015. The current usage metrics is available 48-96 hours after online publication and is updated daily on week days.
Initial download of the metrics may take a while.