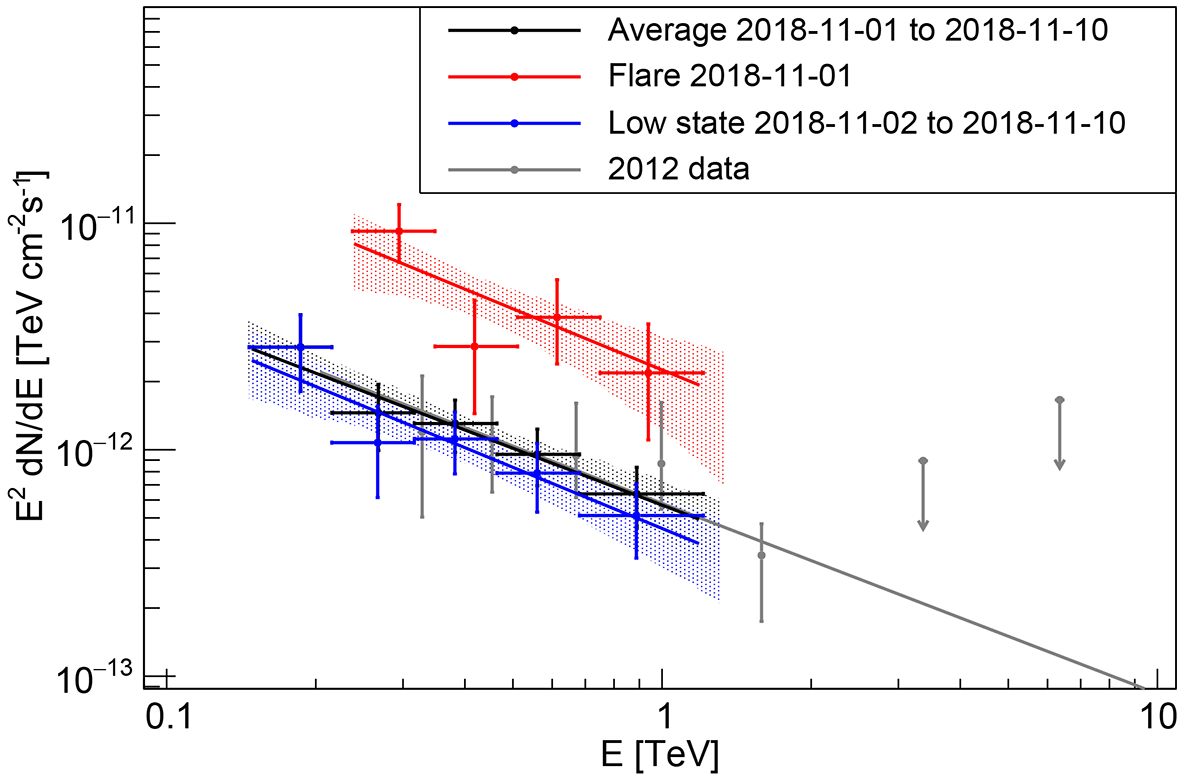
Fig. 2.
Download original image
Spectral energy distributions measured with the H.E.S.S. telescopes in 2018 and 2012. The averaged spectrum is shown with black points/butterfly and a black fit line. The red data points, butterfly and the red line indicate the spectrum measured on 2018-11-01, while the data points/butterfly and the line in blue shows the spectrum computed from the remaining data taken in November 2018. For comparison, we show the results obtained in 2012 in gray (H.E.S.S. Collaboration 2018).
Current usage metrics show cumulative count of Article Views (full-text article views including HTML views, PDF and ePub downloads, according to the available data) and Abstracts Views on Vision4Press platform.
Data correspond to usage on the plateform after 2015. The current usage metrics is available 48-96 hours after online publication and is updated daily on week days.
Initial download of the metrics may take a while.