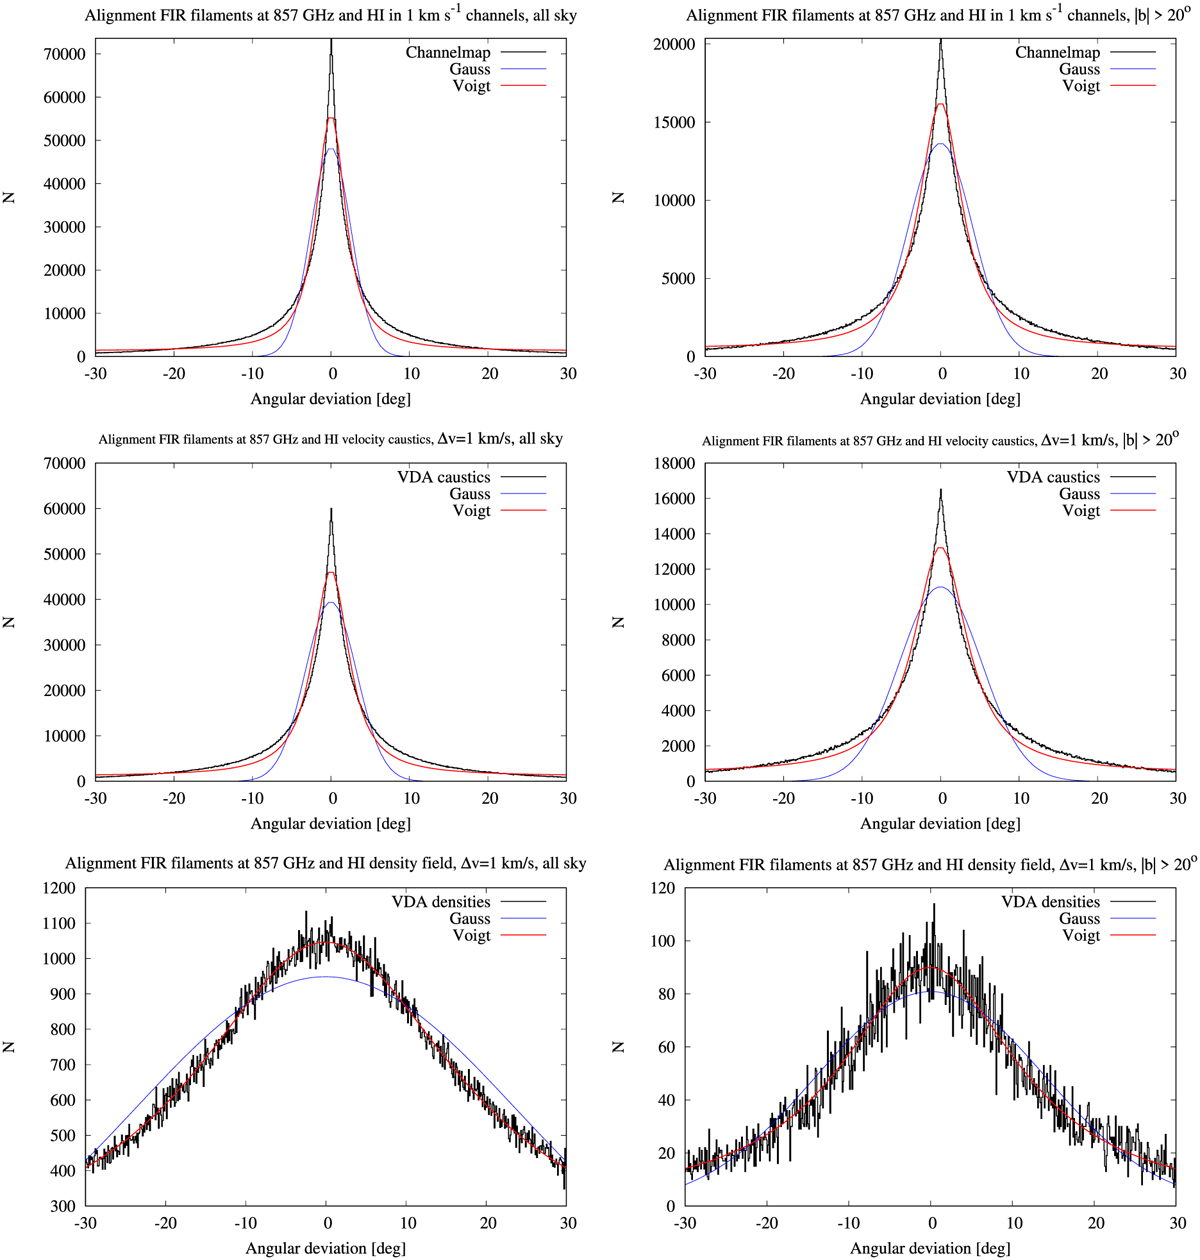
Fig. 3
Download original image
Histograms of angular alignment deviations according to Eq. (5) in Paper I for filamentary structures. Top left: Planck 857 GHz compared with best fit single-channel H I filaments, all sky. Top right: Planck 857 GHz compared with best fit single-channel H I filaments, |b| > 20°. These two plots were replicated from Fig. 3 in Paper I. Center left: Planck 857 GHz compared with best fit filaments from the VDA velocity field pυ, all sky. Center right: Planck 857 GHz compared with best fit filaments from pυ with |b| > 20°. Bottom left: Planck 857 GHz compared with best fit filaments from the VDA density distribution pd, all sky. Bottom right: Planck 857 GHz compared with best fit filaments from the VDA density distribution pd, |b| > 20°.
Current usage metrics show cumulative count of Article Views (full-text article views including HTML views, PDF and ePub downloads, according to the available data) and Abstracts Views on Vision4Press platform.
Data correspond to usage on the plateform after 2015. The current usage metrics is available 48-96 hours after online publication and is updated daily on week days.
Initial download of the metrics may take a while.