Fig. 4.
Download original image
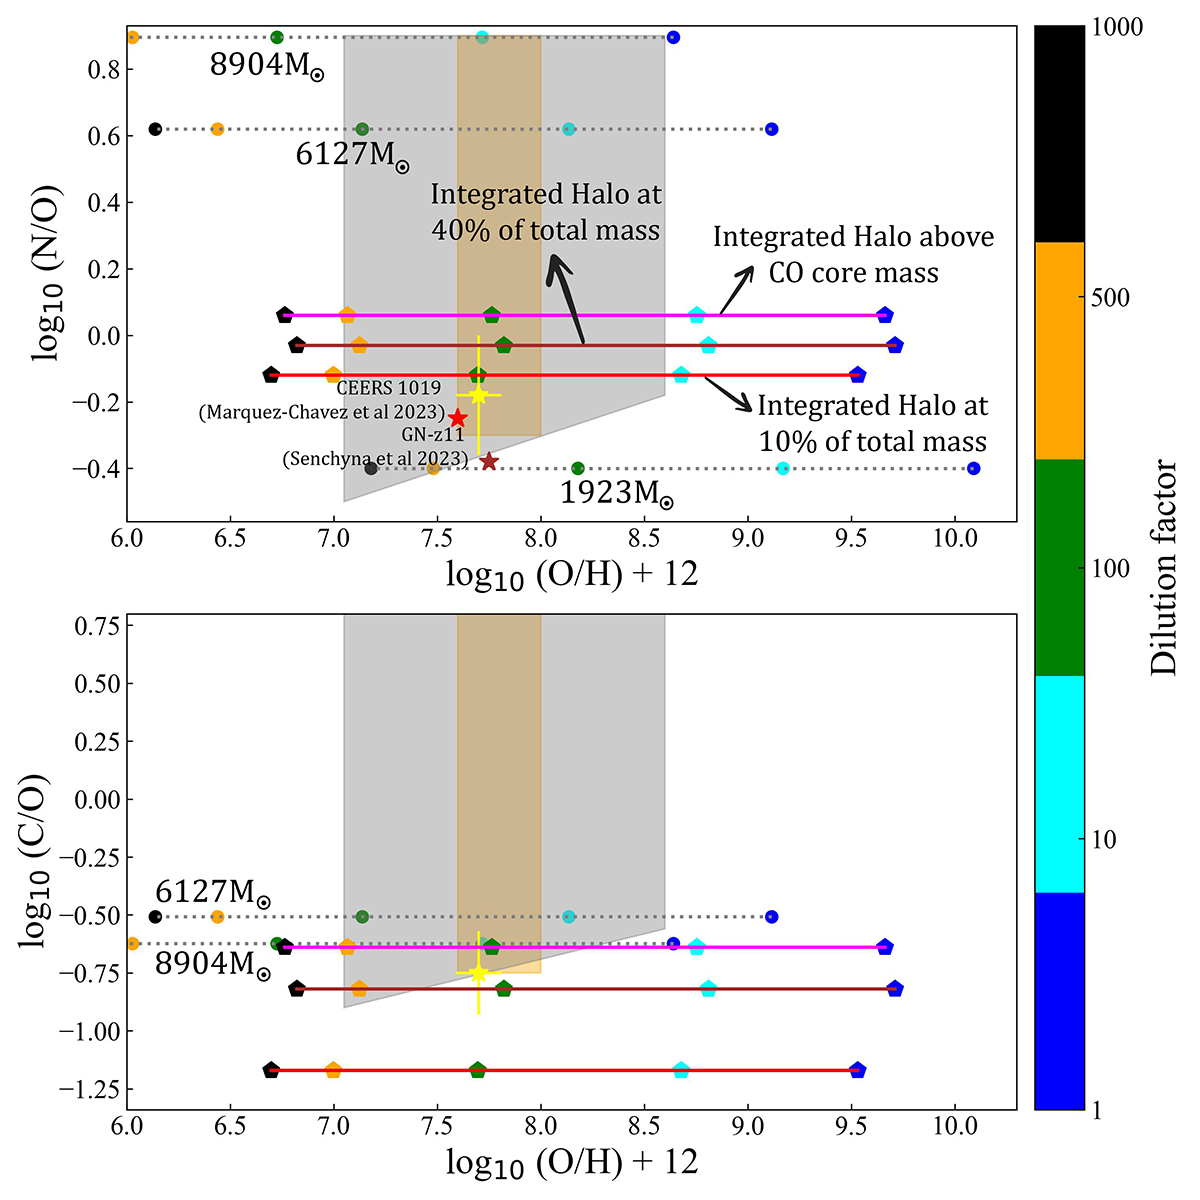
Abundance ratios (in number fractions) in the interstellar medium of the halo as a function of O/H (expressed as log10(O/H) + 12). The dilution factor, f, is given by the colourbar. Dotted lines correspond to the abundance in the ejecta of an individual stellar model. The mass is indicated for each of them. The result for dilution factors equal to 1, 10, 100 and 1000 are shown by coloured circles. The solid lines show the abundances when the ejecta of all the stars in the halo are mixed and mixed also with varying amounts of pristine material: magenta line is for the case when the entire mass above the CO core is assumed to be ejected by each star, brown and red lines for the cases when 40%, respectively 10% of the total mass is ejected. The coloured pentagons on the solid lines show the results for different dilution factors. The grey trapezoid and the orange rectangle represent the conservative and fiducial results for the abundances of GN-z11 by Cameron et al. (2023). The yellow star with error bars correspond to the results of CEERS 1019 as shown in Marques-Chaves et al. (2024). Top panel: N/O abundances as a function of the O/H abundances both in log base 10 scale. The red and brown stars in the top panel are the photoionisation modelling results for GN-z11 by Senchyna et al. (2023). Bottom panel: C/O versus O/H ratios represented in the log base 10 scale.
Current usage metrics show cumulative count of Article Views (full-text article views including HTML views, PDF and ePub downloads, according to the available data) and Abstracts Views on Vision4Press platform.
Data correspond to usage on the plateform after 2015. The current usage metrics is available 48-96 hours after online publication and is updated daily on week days.
Initial download of the metrics may take a while.