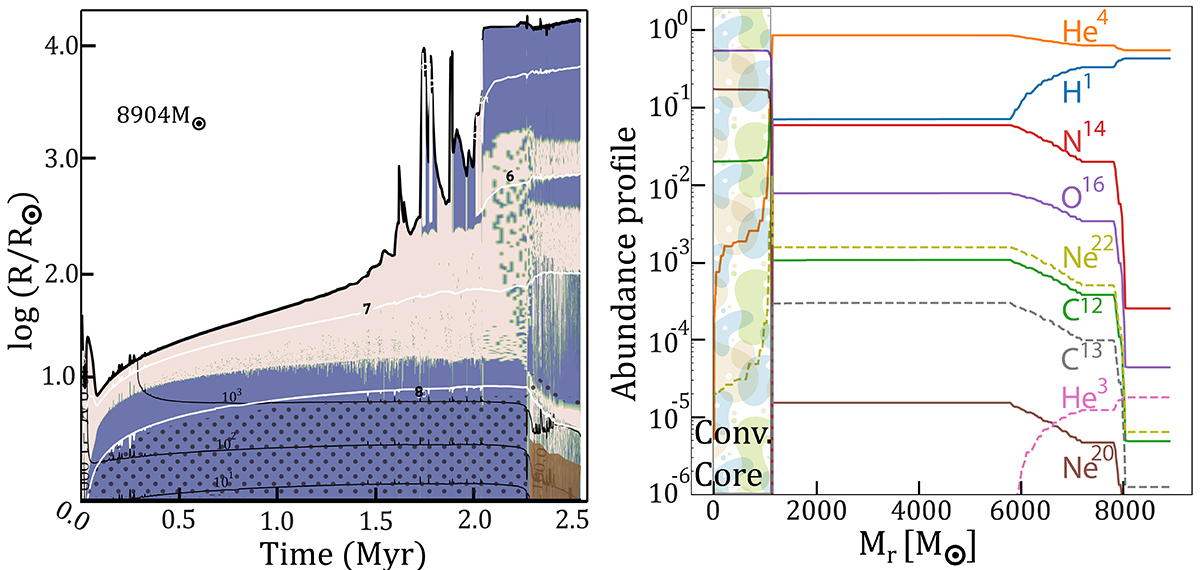
Fig. 2.
Download original image
Test model with a final mass of 8904 M⊙ computed using a constant accretion rate of 3.5 M⊙ yr−1 until the end of core helium burning. Left panel: the Kippenhahn diagram showing the evolution of radius versus time. The blue and cream regions represents the convective and radiative zones respectively. Core hydrogen burning is shown in dotted zone and core helium burning in brown zone. The black lines represents the iso-masses and the white lines depict the iso-thermal lines. Right panel: the abundance profile inside the 8904 M⊙ model at the end of core helium burning. The label for each element matches the corresponding line.
Current usage metrics show cumulative count of Article Views (full-text article views including HTML views, PDF and ePub downloads, according to the available data) and Abstracts Views on Vision4Press platform.
Data correspond to usage on the plateform after 2015. The current usage metrics is available 48-96 hours after online publication and is updated daily on week days.
Initial download of the metrics may take a while.