Fig. 2.
Download original image
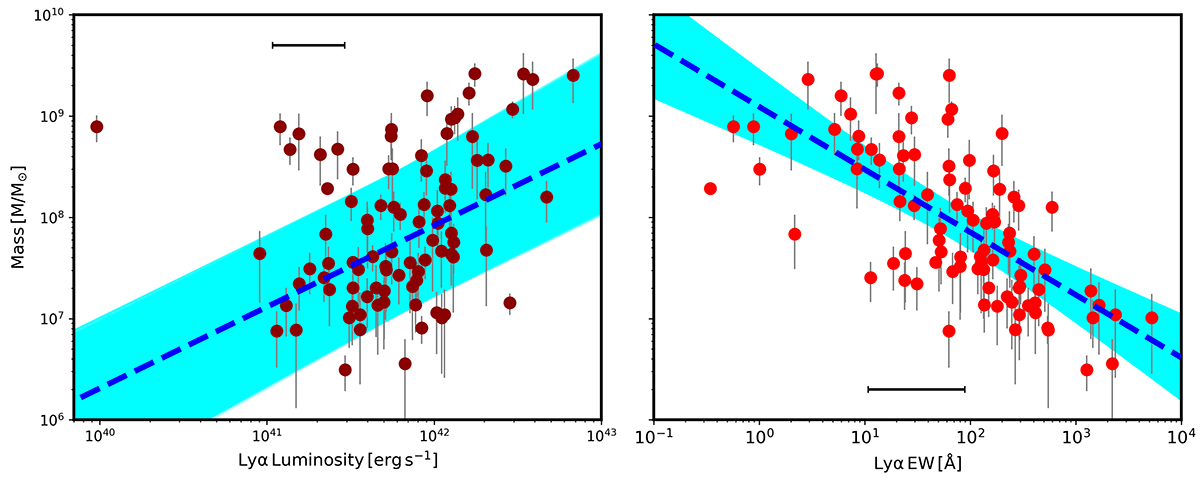
Stellar mass vs Lyman-α parameters. Left: stellar mass plotted against Lyman-α luminosity. Right: stellar mass plotted against EWLyα. Blue dashed lines indicate linear fits to the data and cyan shaded areas the 1σ uncertainties on the fits, details of which are given in the text. Median uncertainties on the Lyman-α parameters are shown by the horizontal black error bars.
Current usage metrics show cumulative count of Article Views (full-text article views including HTML views, PDF and ePub downloads, according to the available data) and Abstracts Views on Vision4Press platform.
Data correspond to usage on the plateform after 2015. The current usage metrics is available 48-96 hours after online publication and is updated daily on week days.
Initial download of the metrics may take a while.