Open Access
Fig. 8
Download original image
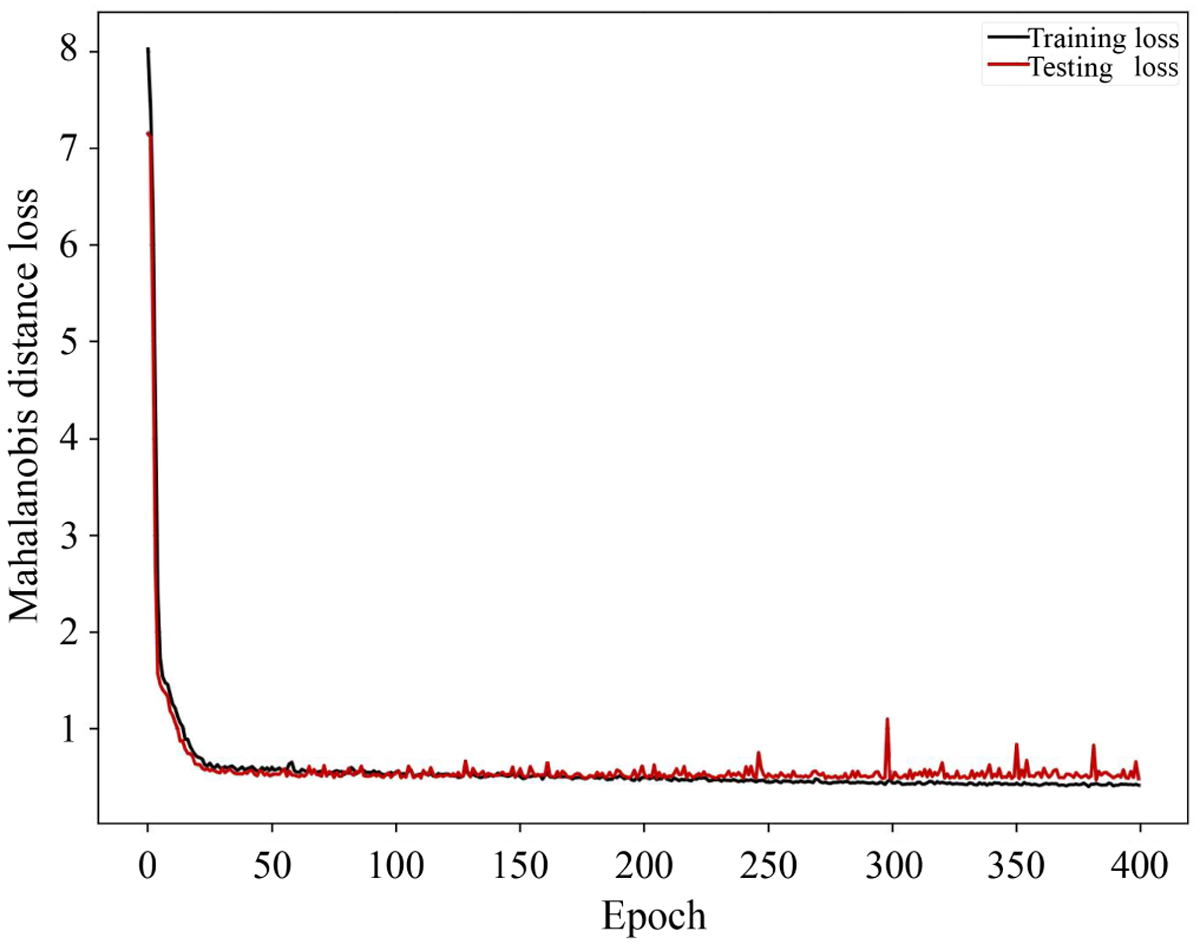
Learning curve based on Mahalanobis distance loss function. This graph illustrates the changes in the loss value based on Maha-lanobis distance. The black and red curves represent the variations in loss values on the training and testing sets, respectively.
Current usage metrics show cumulative count of Article Views (full-text article views including HTML views, PDF and ePub downloads, according to the available data) and Abstracts Views on Vision4Press platform.
Data correspond to usage on the plateform after 2015. The current usage metrics is available 48-96 hours after online publication and is updated daily on week days.
Initial download of the metrics may take a while.