Fig. 4
Download original image
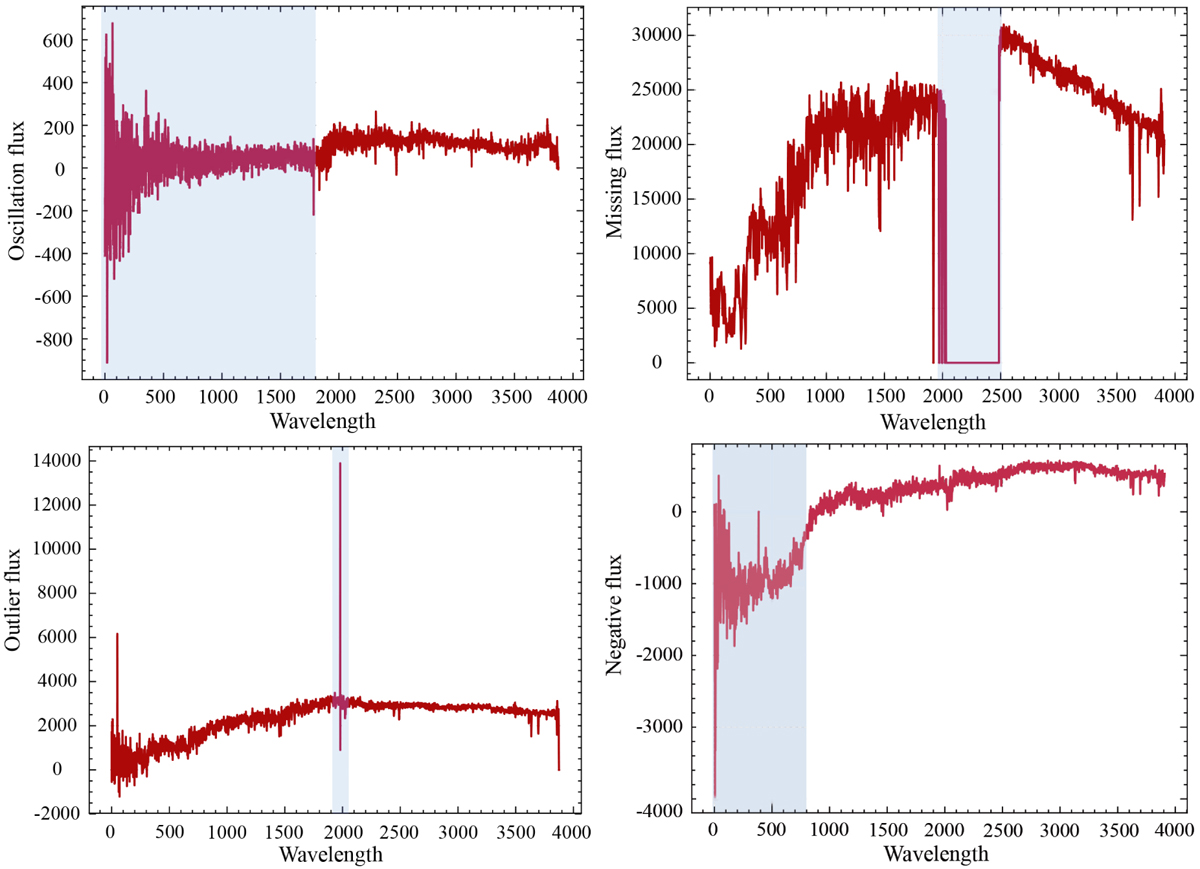
Types of anomalous spectra excluded from this study. The red line shows the trend of flux as a function of wavelength. The shaded regions in each panel show the positions of the anomalies. Top left panel: oscillations. The spectrum shows the repetitive variation of flux about a central value. Top right panel: missing values. These spectra lack values in certain wavelength regions. Bottom left panel: outliers. The spectrum has pronounced peaks or deep troughs. Bottom right panel: negative values. The spectra display negative values at certain wavelengths.
Current usage metrics show cumulative count of Article Views (full-text article views including HTML views, PDF and ePub downloads, according to the available data) and Abstracts Views on Vision4Press platform.
Data correspond to usage on the plateform after 2015. The current usage metrics is available 48-96 hours after online publication and is updated daily on week days.
Initial download of the metrics may take a while.