Open Access
Fig. 12
Download original image
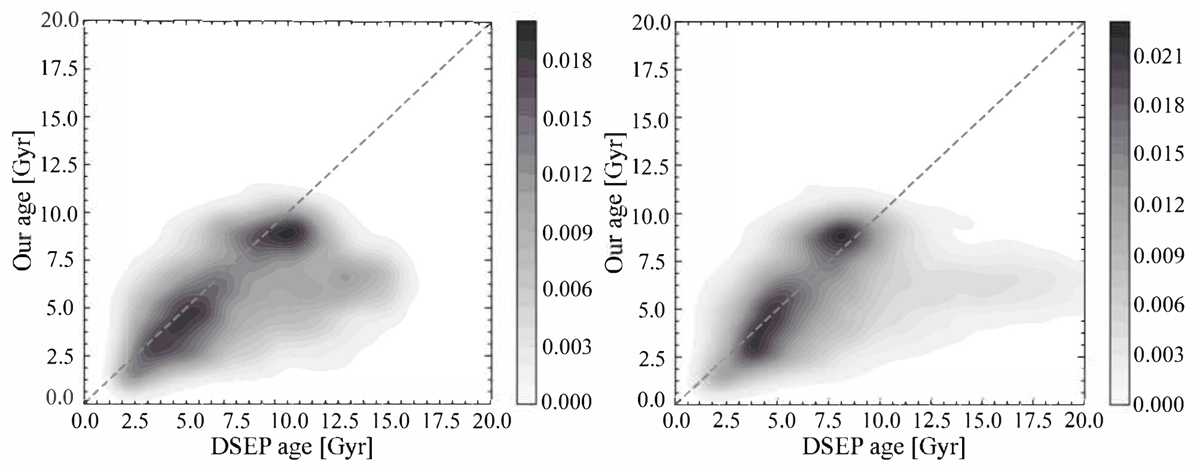
Comparison of ages with different isochrone methods. The horizontal axis represents the age predictions from different isochrone methods, while the vertical axis shows the predictions from our model. Left panel: results in comparison with DSEP (Dotter et al. 2008). Right panel: comparison with MIST (Choi et al. 2016).
Current usage metrics show cumulative count of Article Views (full-text article views including HTML views, PDF and ePub downloads, according to the available data) and Abstracts Views on Vision4Press platform.
Data correspond to usage on the plateform after 2015. The current usage metrics is available 48-96 hours after online publication and is updated daily on week days.
Initial download of the metrics may take a while.