Open Access
Fig. 10
Download original image
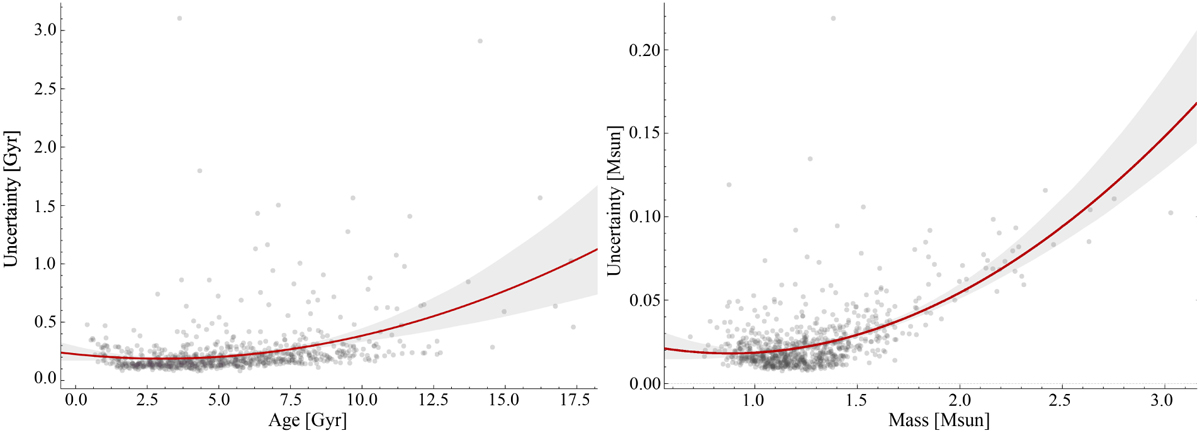
Uncertainties for age (left panel) and mass (right panel) predictions. The red solid lines indicate the trend of uncertainties relative to the true labels. The shaded regions correspond to the 95% uncertainty intervals, representing the primary range of uncertainties provided by the model.
Current usage metrics show cumulative count of Article Views (full-text article views including HTML views, PDF and ePub downloads, according to the available data) and Abstracts Views on Vision4Press platform.
Data correspond to usage on the plateform after 2015. The current usage metrics is available 48-96 hours after online publication and is updated daily on week days.
Initial download of the metrics may take a while.