Fig. 1
Download original image
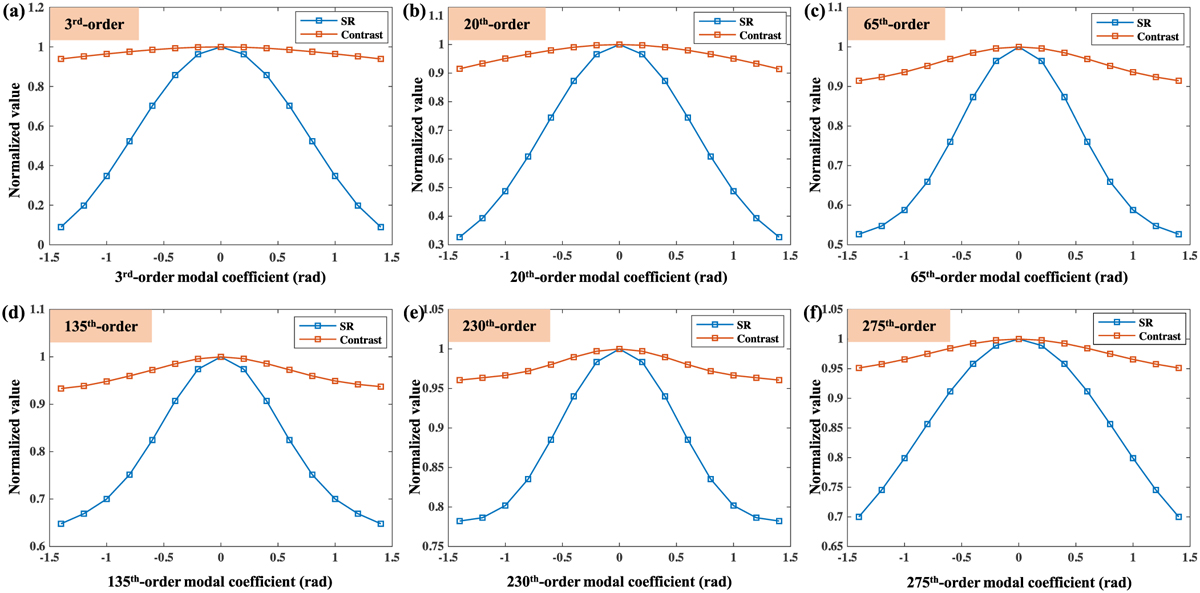
Negative correlation between both the SR of the focal spot image and the contrast of the focal extended object image, and the magnitude of the single-order modal aberration. Panels a–f show the mapping curves with respect to the 3rd, 20th, 65th, 135th, 230th, and 275th modal aberrations, respectively. For each panel, all the values in the “SR” curve were normalized by dividing by their maximum SR, and similarly all the values in the “Contrast” curve were normalized by dividing by their maximum contrast.
Current usage metrics show cumulative count of Article Views (full-text article views including HTML views, PDF and ePub downloads, according to the available data) and Abstracts Views on Vision4Press platform.
Data correspond to usage on the plateform after 2015. The current usage metrics is available 48-96 hours after online publication and is updated daily on week days.
Initial download of the metrics may take a while.