Fig. 7.
Download original image
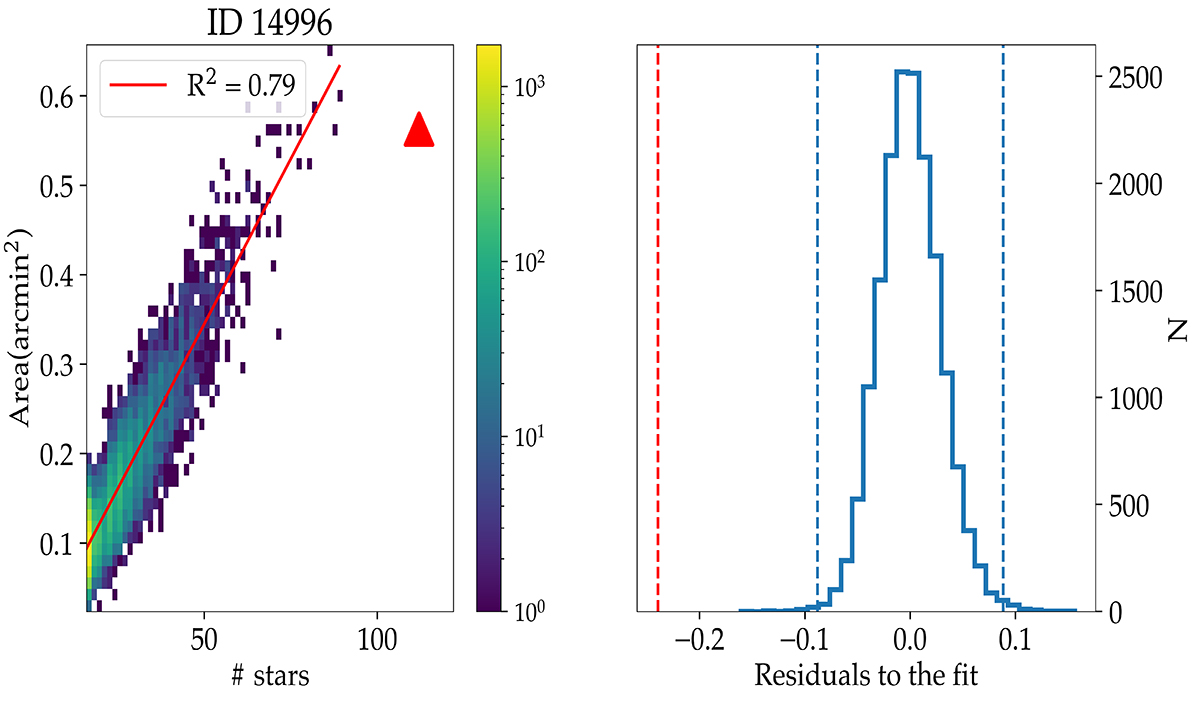
Areal density of the co-moving group associated with star ID 14996 versus simulated clusters. Left: Area versus the number of stars for ∼15 000 statistical clusters identified by the algorithm across 10 000 simulated populations. The red line represents the linear fit between the area and the number of stars. The red triangle represents the co-moving group associated with star ID 14996. Right: Histogram showing the distribution of the residuals for the groups found in the simulated populations to the linear fit. The dashed blue lines mark the ±3σ levels of the distribution. The dashed red line marks the residual to the fit for the co-moving group associated with star ID 14996.
Current usage metrics show cumulative count of Article Views (full-text article views including HTML views, PDF and ePub downloads, according to the available data) and Abstracts Views on Vision4Press platform.
Data correspond to usage on the plateform after 2015. The current usage metrics is available 48-96 hours after online publication and is updated daily on week days.
Initial download of the metrics may take a while.