Fig. 5.
Download original image
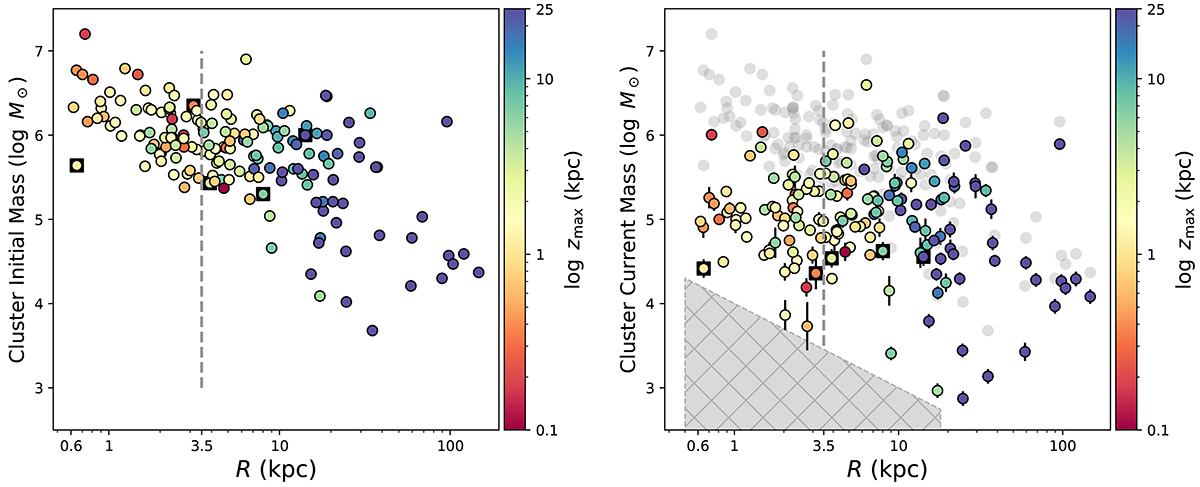
Initial (left panel) and current (right panel) GC masses as a function of spherical galactocentric radius (R), colour-codded by their Zmax. The vertical line at 3.5 kpc is the estimated radius of the Galactic bulge. The grey hatched area in the right panel highlights the region where no GC has been discovered, implying an observational limit on the mass and orbital configuration below which GCs are more efficiently disrupted by the dynamical processes in the MW. The clusters analysed in this work are highlighted by squares in both panels. They are, in order of increasing R, Gran 1, 5, 3, 2, and 4. The right panel also contains the initial cluster masses derived by Baumgardt et al. (2019) as grey background points, as a reference for the initial-to-final mass ratio of the GCs.
Current usage metrics show cumulative count of Article Views (full-text article views including HTML views, PDF and ePub downloads, according to the available data) and Abstracts Views on Vision4Press platform.
Data correspond to usage on the plateform after 2015. The current usage metrics is available 48-96 hours after online publication and is updated daily on week days.
Initial download of the metrics may take a while.