Open Access
Fig. 8
Download original image
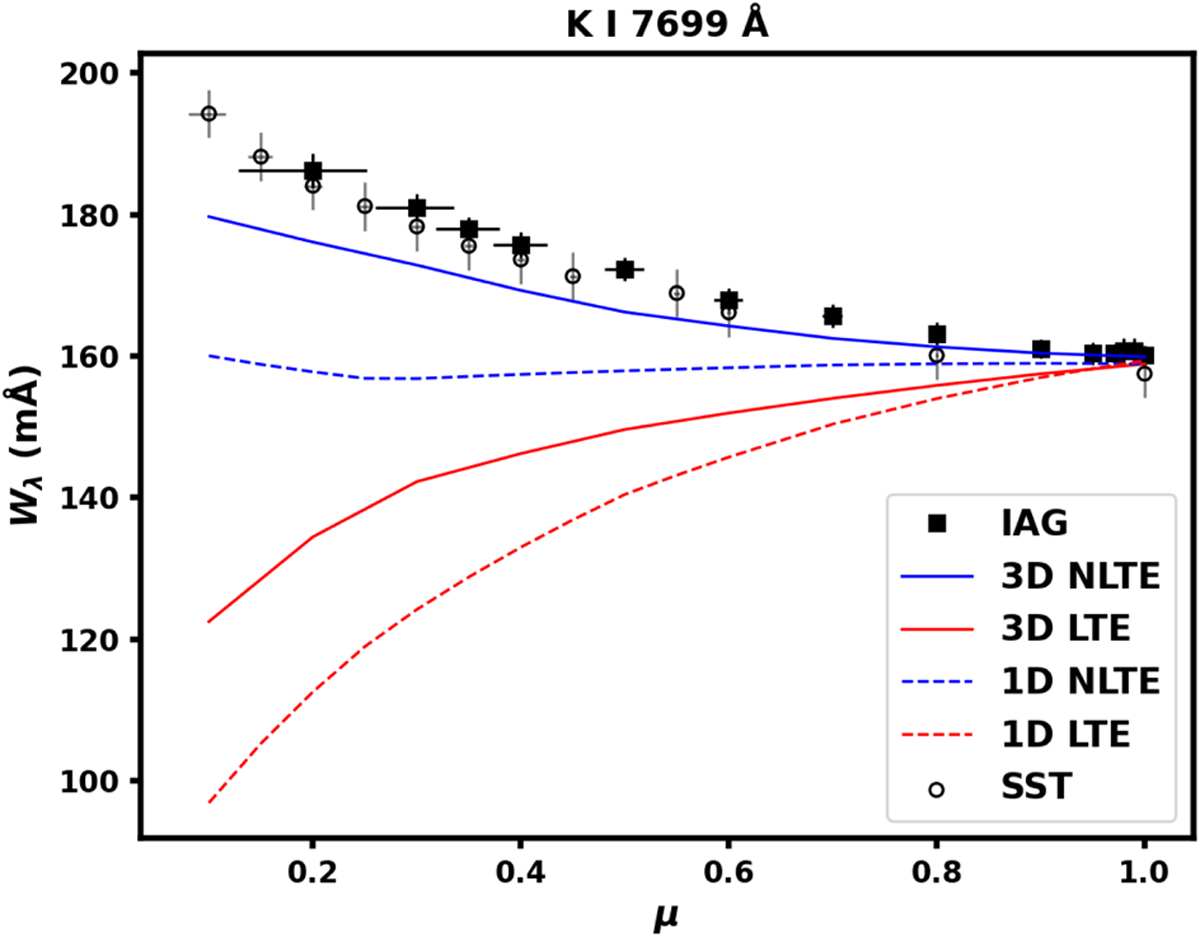
Center-to-limb variation of the K I 7699 Å line. Comparison of the IAG Atlas (filled squares) and the SST data (open circles) with several different model atmospheres and atomic data, colored as in the figure legend.
Current usage metrics show cumulative count of Article Views (full-text article views including HTML views, PDF and ePub downloads, according to the available data) and Abstracts Views on Vision4Press platform.
Data correspond to usage on the plateform after 2015. The current usage metrics is available 48-96 hours after online publication and is updated daily on week days.
Initial download of the metrics may take a while.