Open Access
Fig. 5.
Download original image
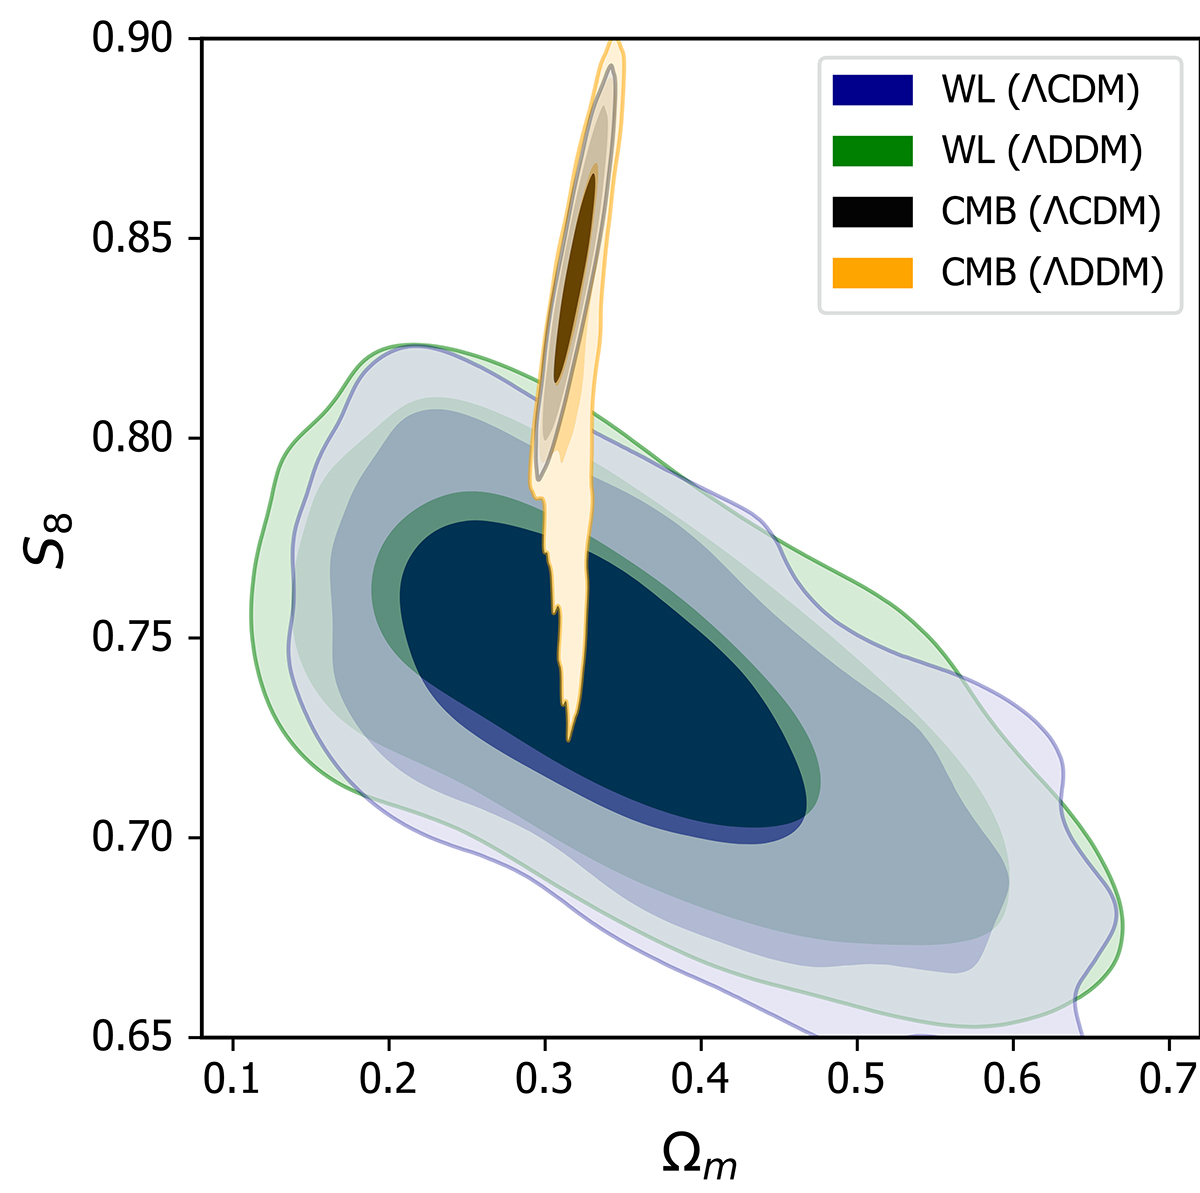
Two-dimensional posterior distributions of Ωm and S8 as resulting from MCMC analysis highlighting the 68%, 95%, and 99% confidence intervals. The WL results are shown in dark blue (ΛCDM) and green (ΛDDM), while the findings based on CMB data are displayed as black (ΛCDM) and orange (ΛDDM) contours.
Current usage metrics show cumulative count of Article Views (full-text article views including HTML views, PDF and ePub downloads, according to the available data) and Abstracts Views on Vision4Press platform.
Data correspond to usage on the plateform after 2015. The current usage metrics is available 48-96 hours after online publication and is updated daily on week days.
Initial download of the metrics may take a while.