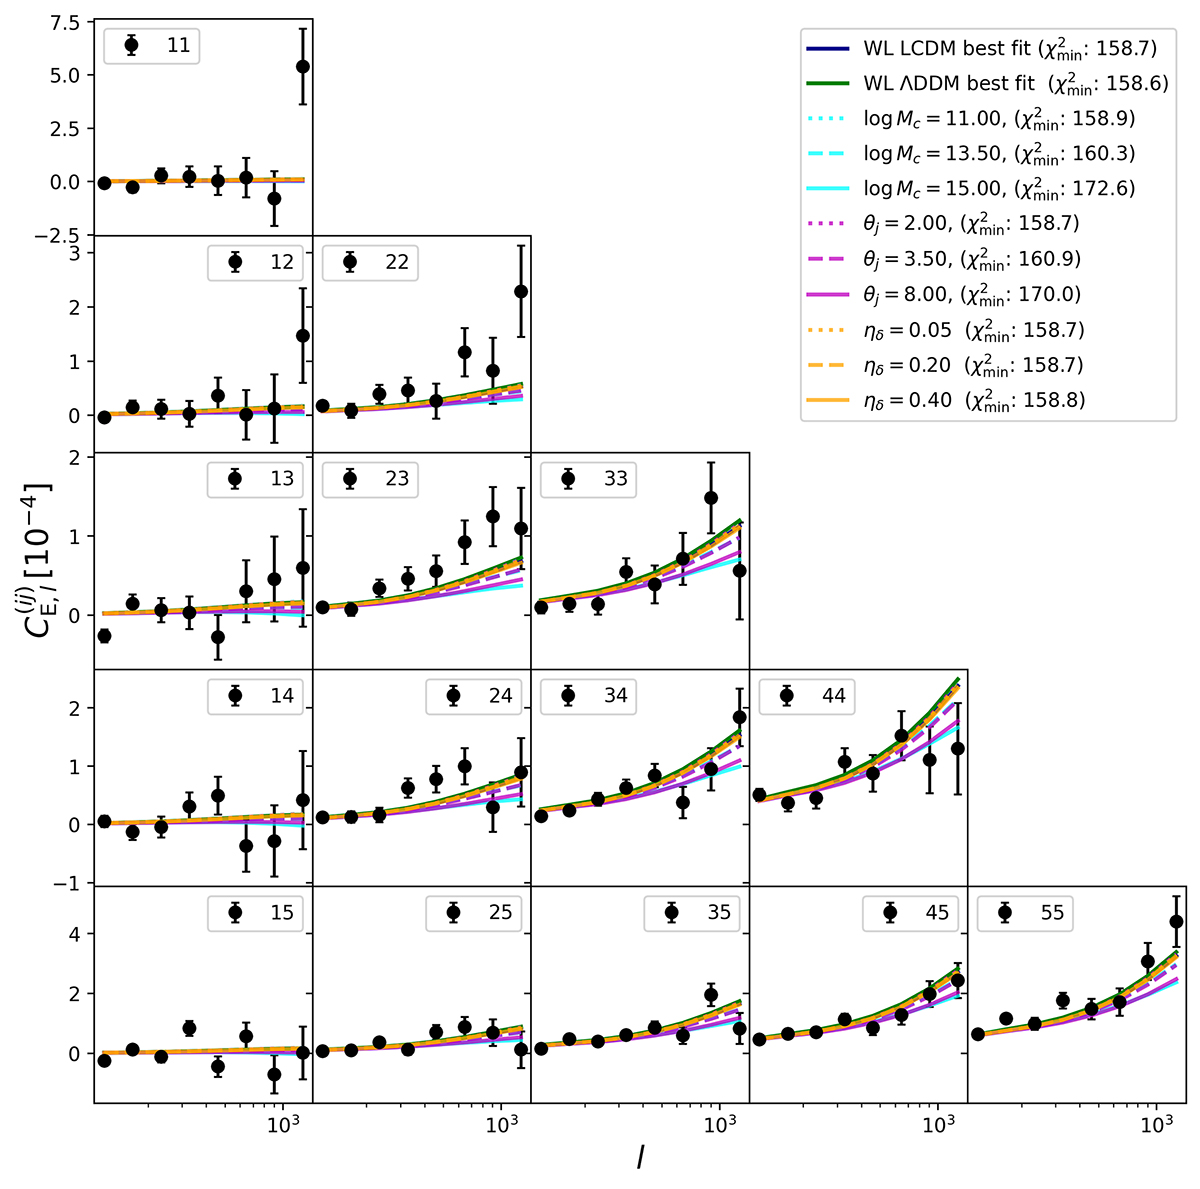
Fig. C.2.
Download original image
Effects of baryons on band power spectra illustrated using different baryonic parameter configurations. Band power auto- and cross-correlations for five tomographic bins with respective error bars as measured by the KiDS-1000 survey are shown as black dots. Solid dark blue (green) lines represent the best fit in the case of ΛCDM (ΛDDM), and the cyan, magenta, and orange lines depict the model predictions for different modifications of the ΛCDM best fit, varying baryonic parameters. In the legend, we include the minimum χ2 value for every plotted configuration.
Current usage metrics show cumulative count of Article Views (full-text article views including HTML views, PDF and ePub downloads, according to the available data) and Abstracts Views on Vision4Press platform.
Data correspond to usage on the plateform after 2015. The current usage metrics is available 48-96 hours after online publication and is updated daily on week days.
Initial download of the metrics may take a while.