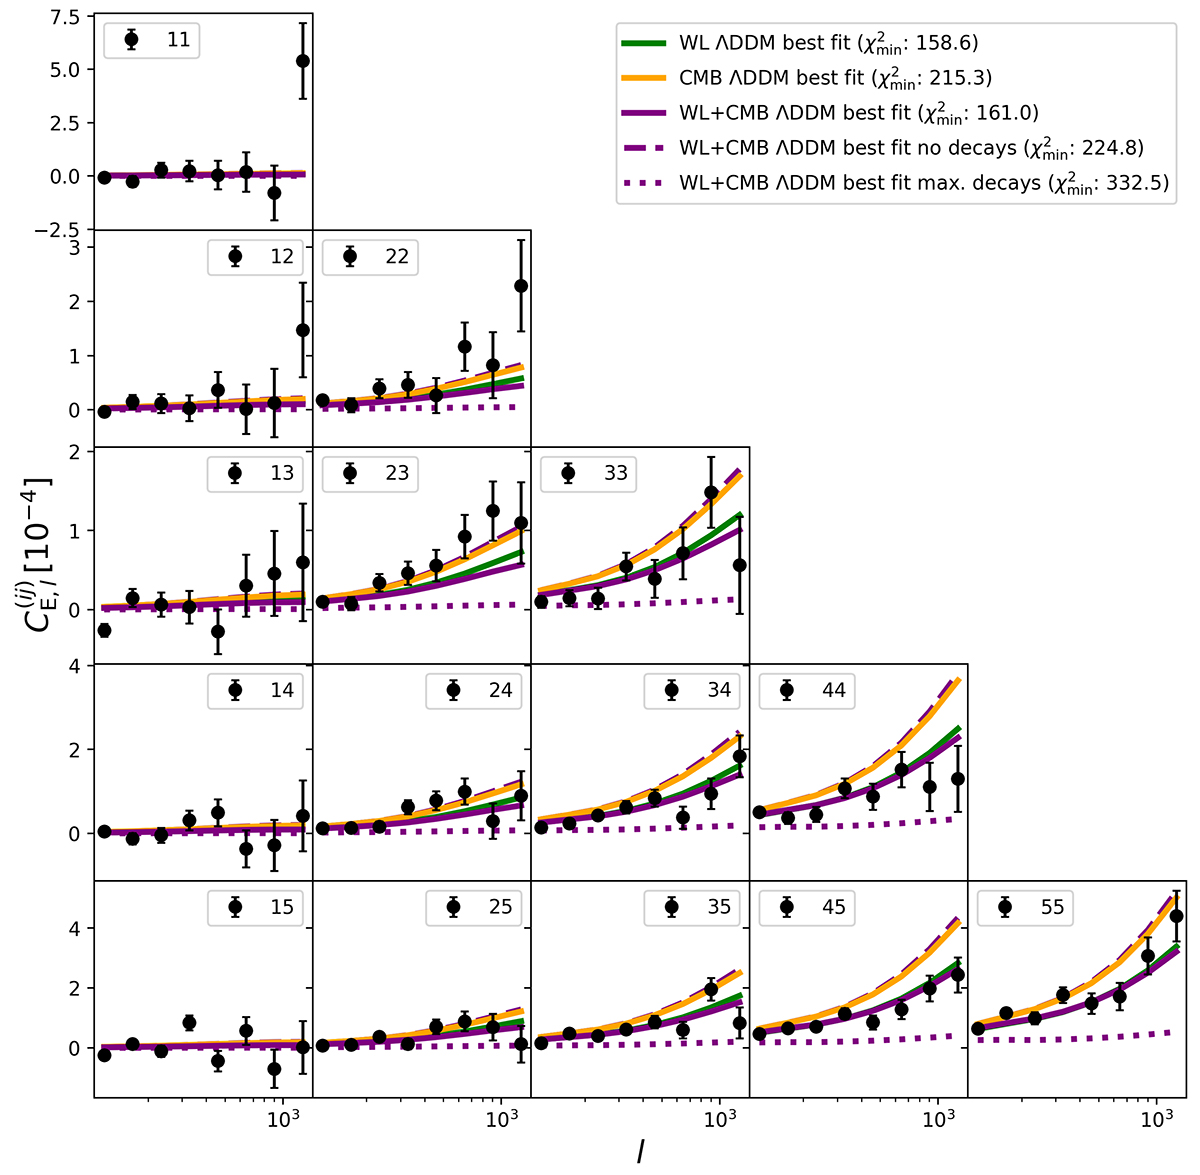
Fig. C.1.
Download original image
Effects of two-body decays on band power spectra illustrated using different forward-modelled ΛDDM configurations. Band power auto- and cross-correlations for five tomographic bins with respective error bars as measured by the KiDS-1000 survey are shown as black dots. Solid green (orange) lines represent the best-fit configurations of the WL (CMB) analysis projected on the band powers. The purple lines represent the different configurations of the WL plus CMB setup in ΛDDM cosmology. The solid lines show the best fit, while the dashed and dotted lines respectively illustrate the impact of underestimating and overestimating the two-body decays, keeping all the remaining parameters fixed to those of the WL plus CMB best fit. In the legend, we include the minimal χ2 value for every plotted configuration.
Current usage metrics show cumulative count of Article Views (full-text article views including HTML views, PDF and ePub downloads, according to the available data) and Abstracts Views on Vision4Press platform.
Data correspond to usage on the plateform after 2015. The current usage metrics is available 48-96 hours after online publication and is updated daily on week days.
Initial download of the metrics may take a while.