Fig. 4
Download original image
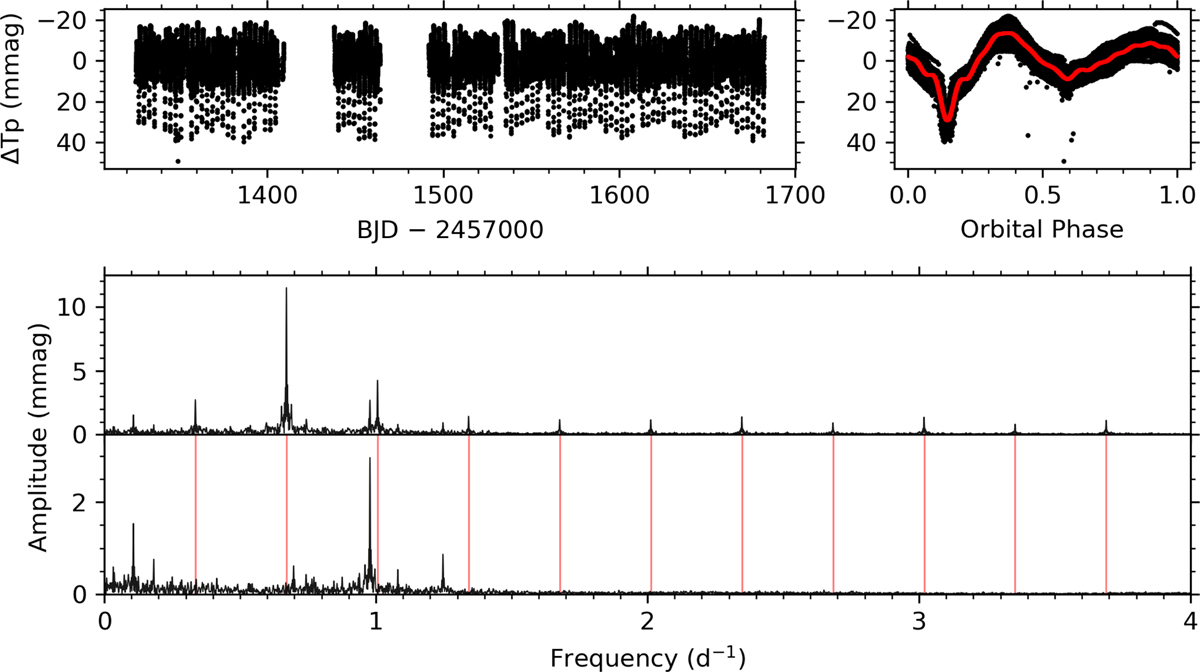
Example summary figure for TIC 150442264. Top panels: FFI-extracted light curve versus time (left) and phase folded on the orbital period for all available cycle 1 sectors (right). Bottom panels: original and residual amplitude spectra in which vertical red lines denote the location of significant orbital harmonics that comprise the analytic binary model, which is also shown as a red line in the phase-folded light curve panel.
Current usage metrics show cumulative count of Article Views (full-text article views including HTML views, PDF and ePub downloads, according to the available data) and Abstracts Views on Vision4Press platform.
Data correspond to usage on the plateform after 2015. The current usage metrics is available 48-96 hours after online publication and is updated daily on week days.
Initial download of the metrics may take a while.