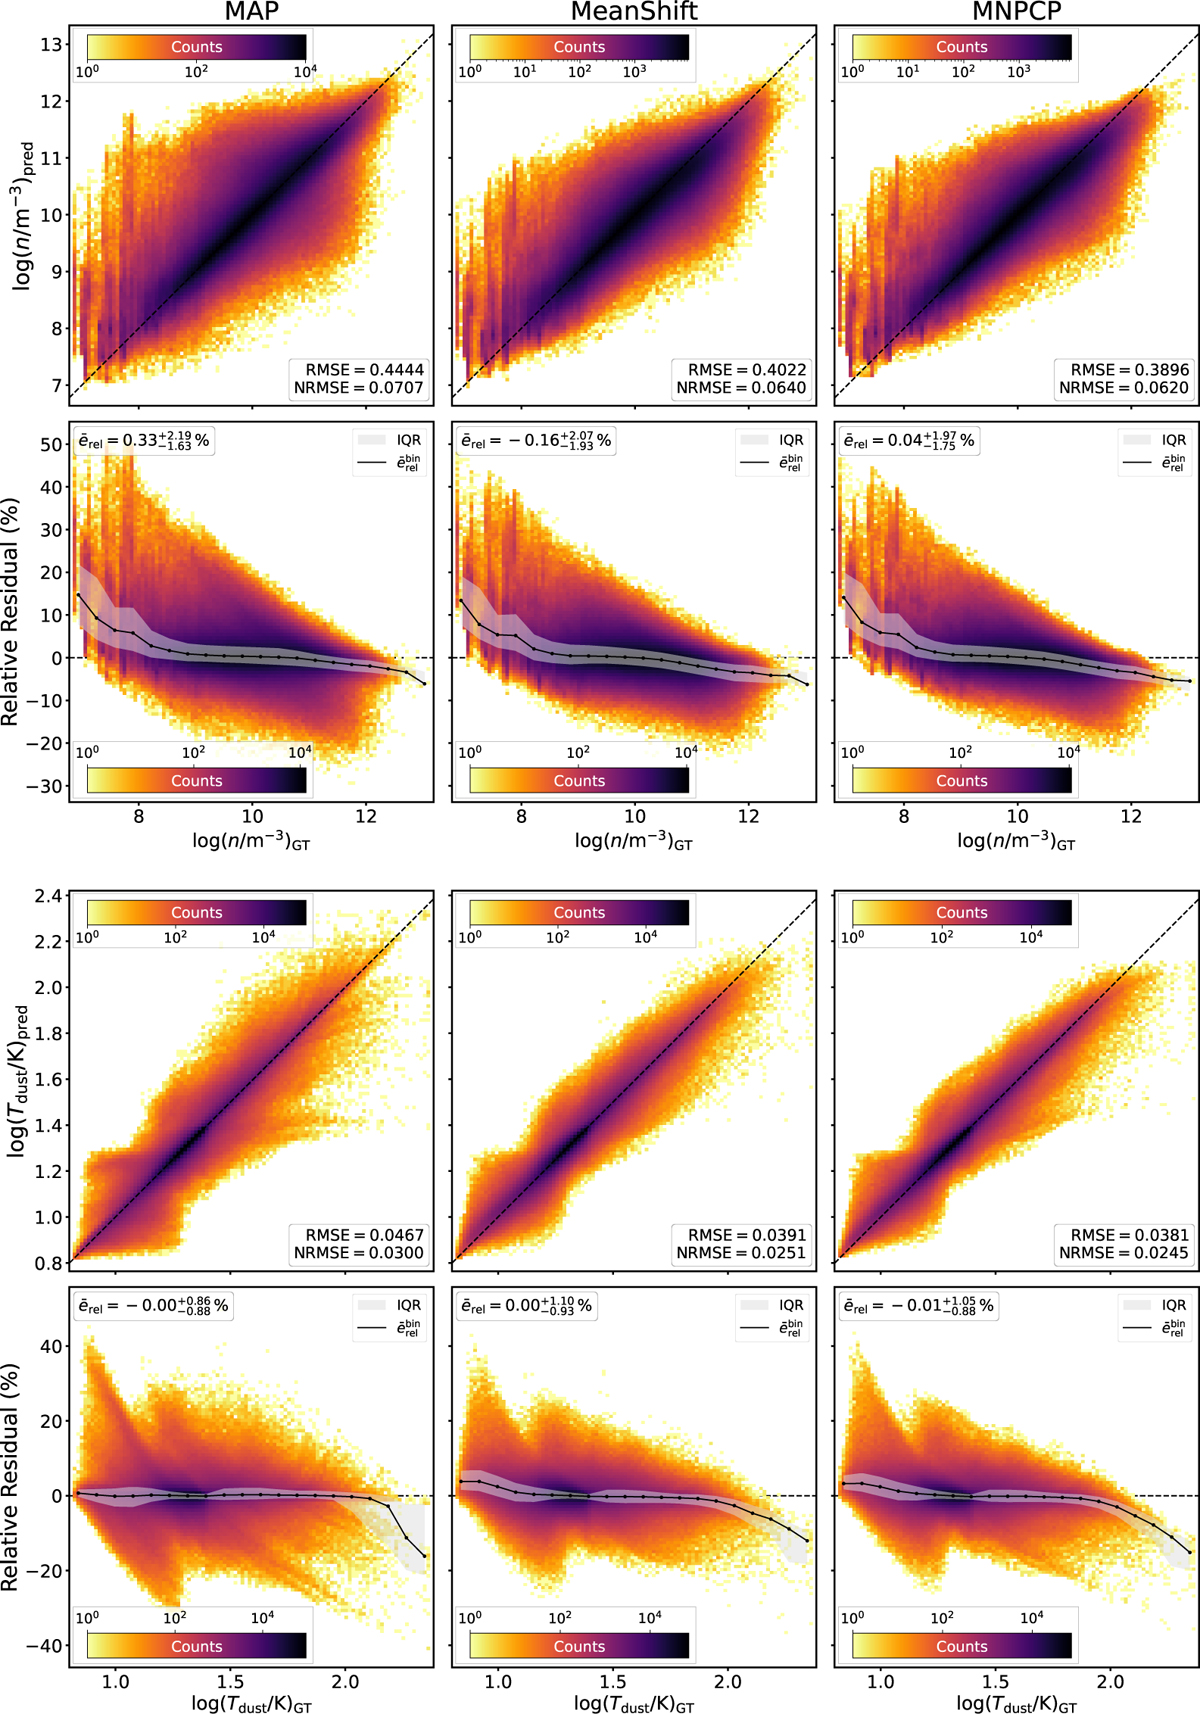
Fig. 4
Download original image
Performance breakdown of the SLoS-cINN using 23 wavelengths. 2D histograms comparing the cINN predictions for dust density (top two rows) and temperature (bottom two rows) to the ground truth across all pixels of the test set data are given, distinguishing the results of the three point estimation procedures: MAP, MeanShift, and MNPCP. Rows 1 and 3 present the direct one-to-one correlation of the predicted parameters to the ground truth, whereas rows 2 and 4 provide the corresponding relative residuals. In the latter panels, the black curve and grey shaded area indicates a binned median relative residual along with the interquantile range between the 25% and 75% quantile of these bins.
Current usage metrics show cumulative count of Article Views (full-text article views including HTML views, PDF and ePub downloads, according to the available data) and Abstracts Views on Vision4Press platform.
Data correspond to usage on the plateform after 2015. The current usage metrics is available 48-96 hours after online publication and is updated daily on week days.
Initial download of the metrics may take a while.