Fig. 6
Download original image
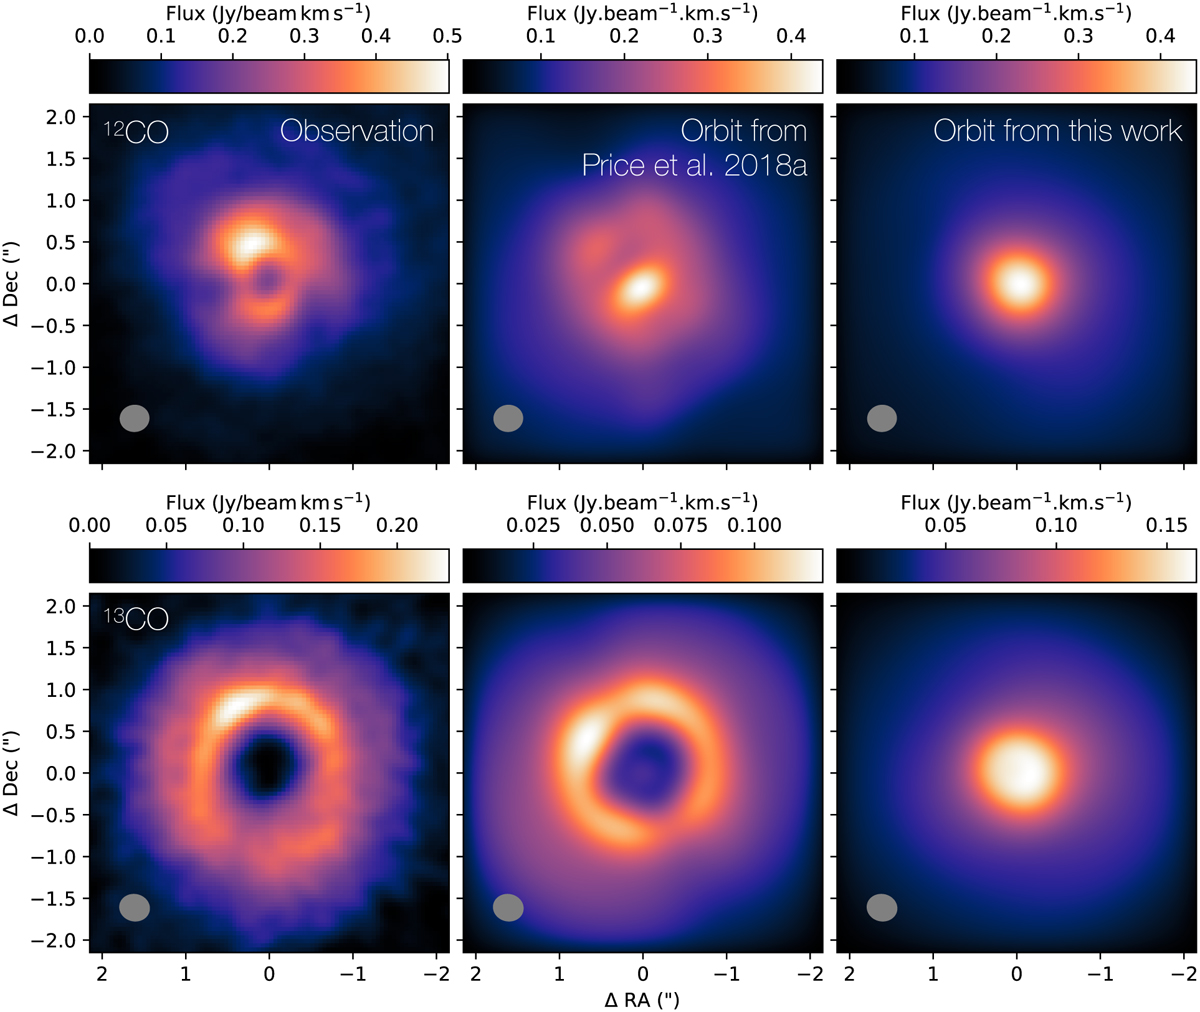
Comparison between observed and simulated 12CO and 13CO maps for the HD142527 disc. The top and bottom panels show the 12CO and 13CO J = 2 − 1 emission, respectively. The left panels are the observations (Garg et al. 2021). The middle and right panels are synthetic emissions predicted from the simulations. The middle panels are from the simulation shown in the left panel of Fig. 4 which uses the disc and binary set-up as the R2 orbit in Price et al. (2018a). The right panels are from the simulations shown in the right panel of Fig. 4, which uses the updated binary parameters in Table 3. In general, the new binary orbit results in a lack of substructure in either molecule. Additionally, the lack of a cavity in 13CO further highlights that the companion alone cannot reproduce the disc features.
Current usage metrics show cumulative count of Article Views (full-text article views including HTML views, PDF and ePub downloads, according to the available data) and Abstracts Views on Vision4Press platform.
Data correspond to usage on the plateform after 2015. The current usage metrics is available 48-96 hours after online publication and is updated daily on week days.
Initial download of the metrics may take a while.