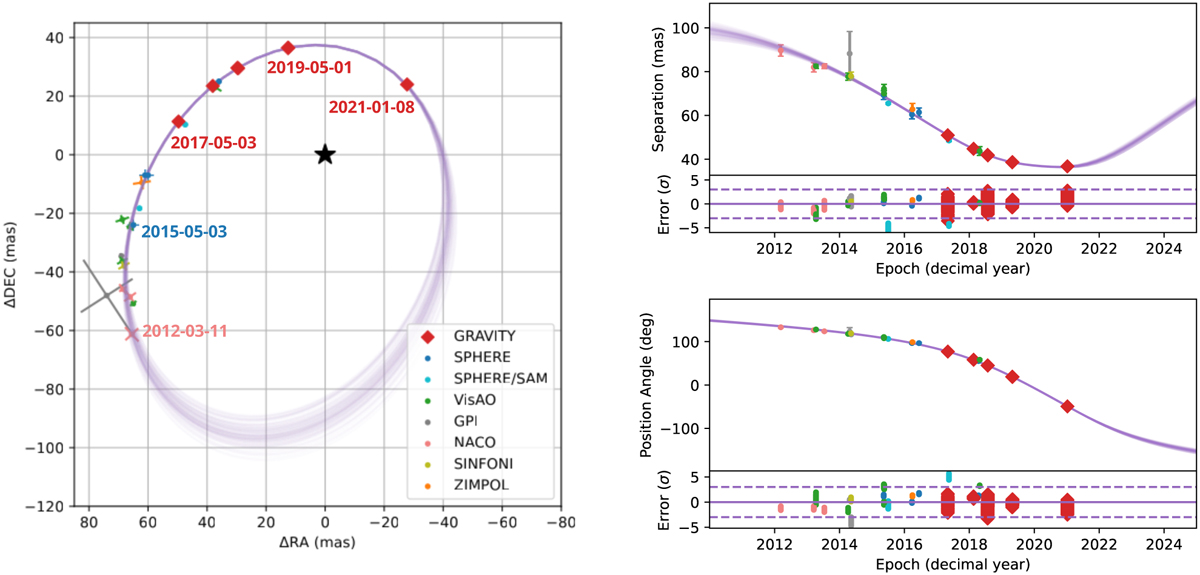
Fig. 3
Download original image
Illustration of the orbit fit. The left panel shows 100 samples drawn randomly from our posterior distribution, overplotted on the astrometric measurements of Table 2. The two panels on the right present the same orbits in separation (upper panel) and position angle (lower panel). For each panel, we show the 100 orbits and the astrometric measurements in the upper graph, and the difference (in units of σ, the error bars on the measurements) in the lower plot. The two dotted lines show the 3σ interval.
Current usage metrics show cumulative count of Article Views (full-text article views including HTML views, PDF and ePub downloads, according to the available data) and Abstracts Views on Vision4Press platform.
Data correspond to usage on the plateform after 2015. The current usage metrics is available 48-96 hours after online publication and is updated daily on week days.
Initial download of the metrics may take a while.