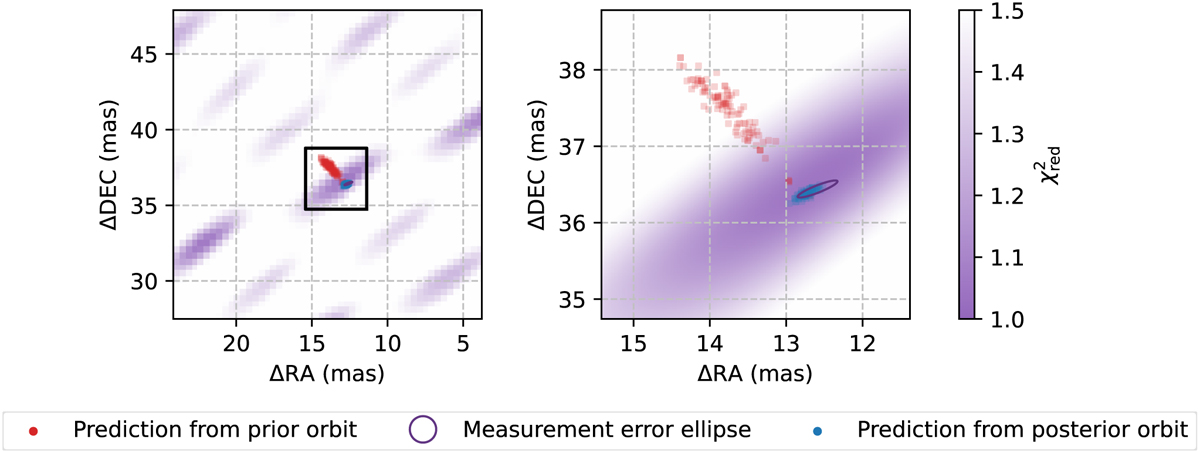
Fig. 1
Download original image
Typical example of a χ2 map obtained when reducing our data (in this case, for the observation on 2019 April 28). The left panel shows the structure of the χ2 map on a large scale, where the multiple minimums (in purple) are clearly visible. The right panel is a zoomed-in version. In each panel the red dots are generated by performing an orbit fit with all the astrometric measurement data available (including all GRAVITY epochs up to 2019 April 28), and using the posterior distributions of orbital parameters to calculate the estimated position at epoch 2019 April 28. The purple ellipse corresponds to the 3σ contour for the astrometric solution. The blue dots are obtained in a similar way, but using a new orbit fit that includes the astrometry extracted from this epoch. In other words, the red dots represents the prediction using the a priori orbital solution, the purple ellipse represents the measurement obtained at this epoch, and the blue dots represent the prediction using the a posteriori updated orbital solution.
Current usage metrics show cumulative count of Article Views (full-text article views including HTML views, PDF and ePub downloads, according to the available data) and Abstracts Views on Vision4Press platform.
Data correspond to usage on the plateform after 2015. The current usage metrics is available 48-96 hours after online publication and is updated daily on week days.
Initial download of the metrics may take a while.