Fig. 7

Download original image
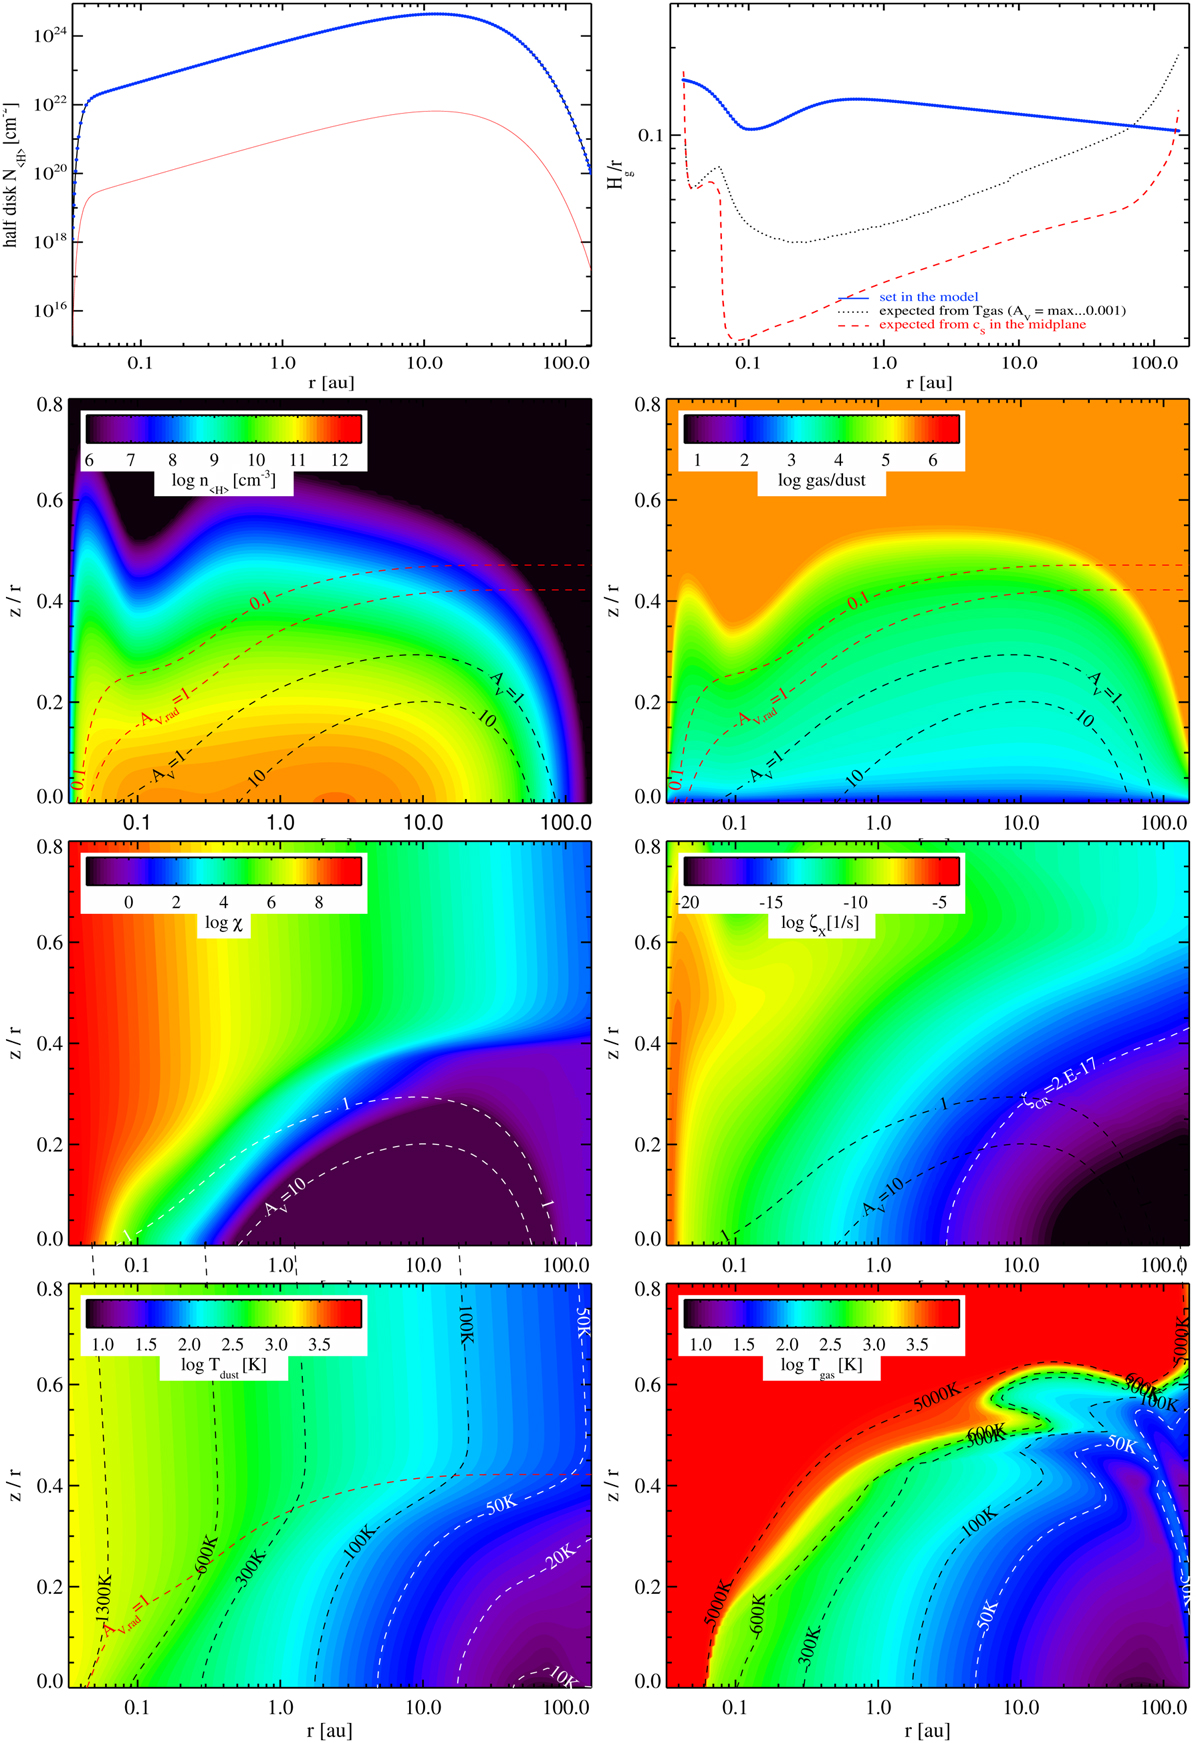
PRODIMO model for the quiescent state of EX Lupi. The top plots show the assumed gas and dust column densities (left) and scale heights (right). The second row shows the corresponding gas densities (left) and gas-to-dust mass ratio after settling (right). The third row shows the UV field strength χ (left), and the X-ray ionisation rate ζX in comparison to the cosmic-ray ionisation rate (right). The bottom row shows the resulting dust-temperature (left) and gas-temperature (right) structures. Additional contour lines show selected values for the vertical optical extinction AV and the radial optical extinction AV,rad as indicated.
Current usage metrics show cumulative count of Article Views (full-text article views including HTML views, PDF and ePub downloads, according to the available data) and Abstracts Views on Vision4Press platform.
Data correspond to usage on the plateform after 2015. The current usage metrics is available 48-96 hours after online publication and is updated daily on week days.
Initial download of the metrics may take a while.


