Fig. 2

Download original image
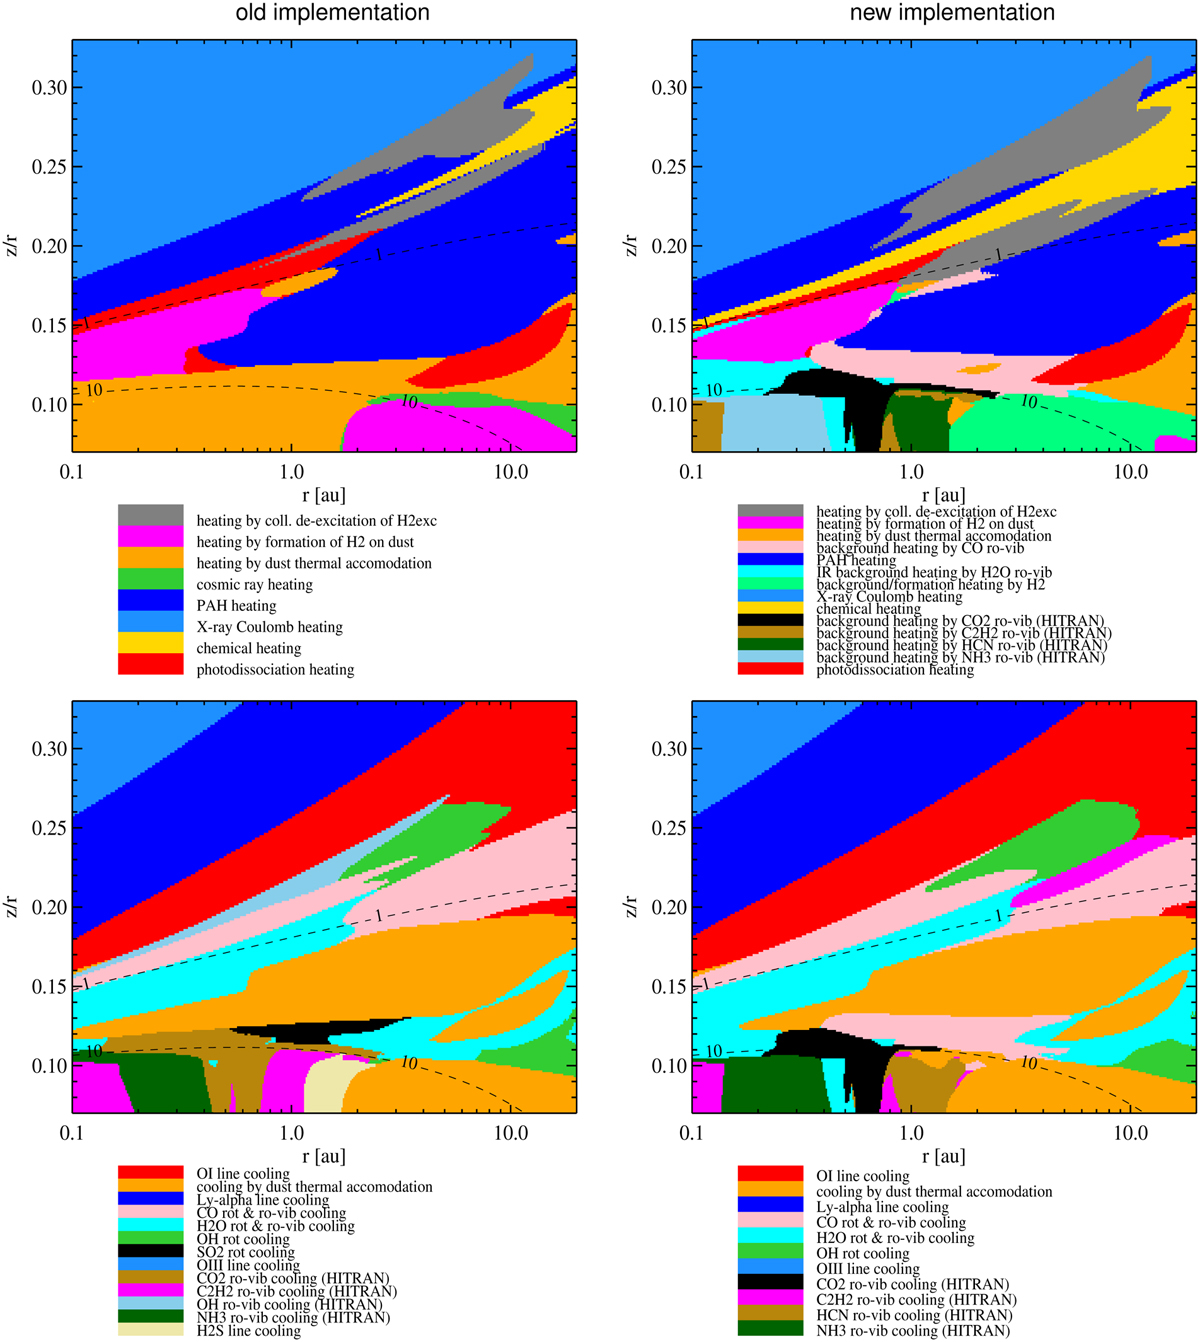
Change in heating and cooling balance with the new escape probability treatment and the new 2D concept to apply UV molecular shielding factors. The plots show the leading heating process (top) and the leading cooling process (bottom) in a zoomed-in disc region responsible for the disc IR line emissions. Processes are only plotted when they fill at least 1% of the area in these plots. The dashed lines mark the visual disc surface Av,rad = 1 and the vertical optical extinction AV = 10. The model includes 103 heating and 95 cooling processes with 64910 spectral lines altogether.
Current usage metrics show cumulative count of Article Views (full-text article views including HTML views, PDF and ePub downloads, according to the available data) and Abstracts Views on Vision4Press platform.
Data correspond to usage on the plateform after 2015. The current usage metrics is available 48-96 hours after online publication and is updated daily on week days.
Initial download of the metrics may take a while.


