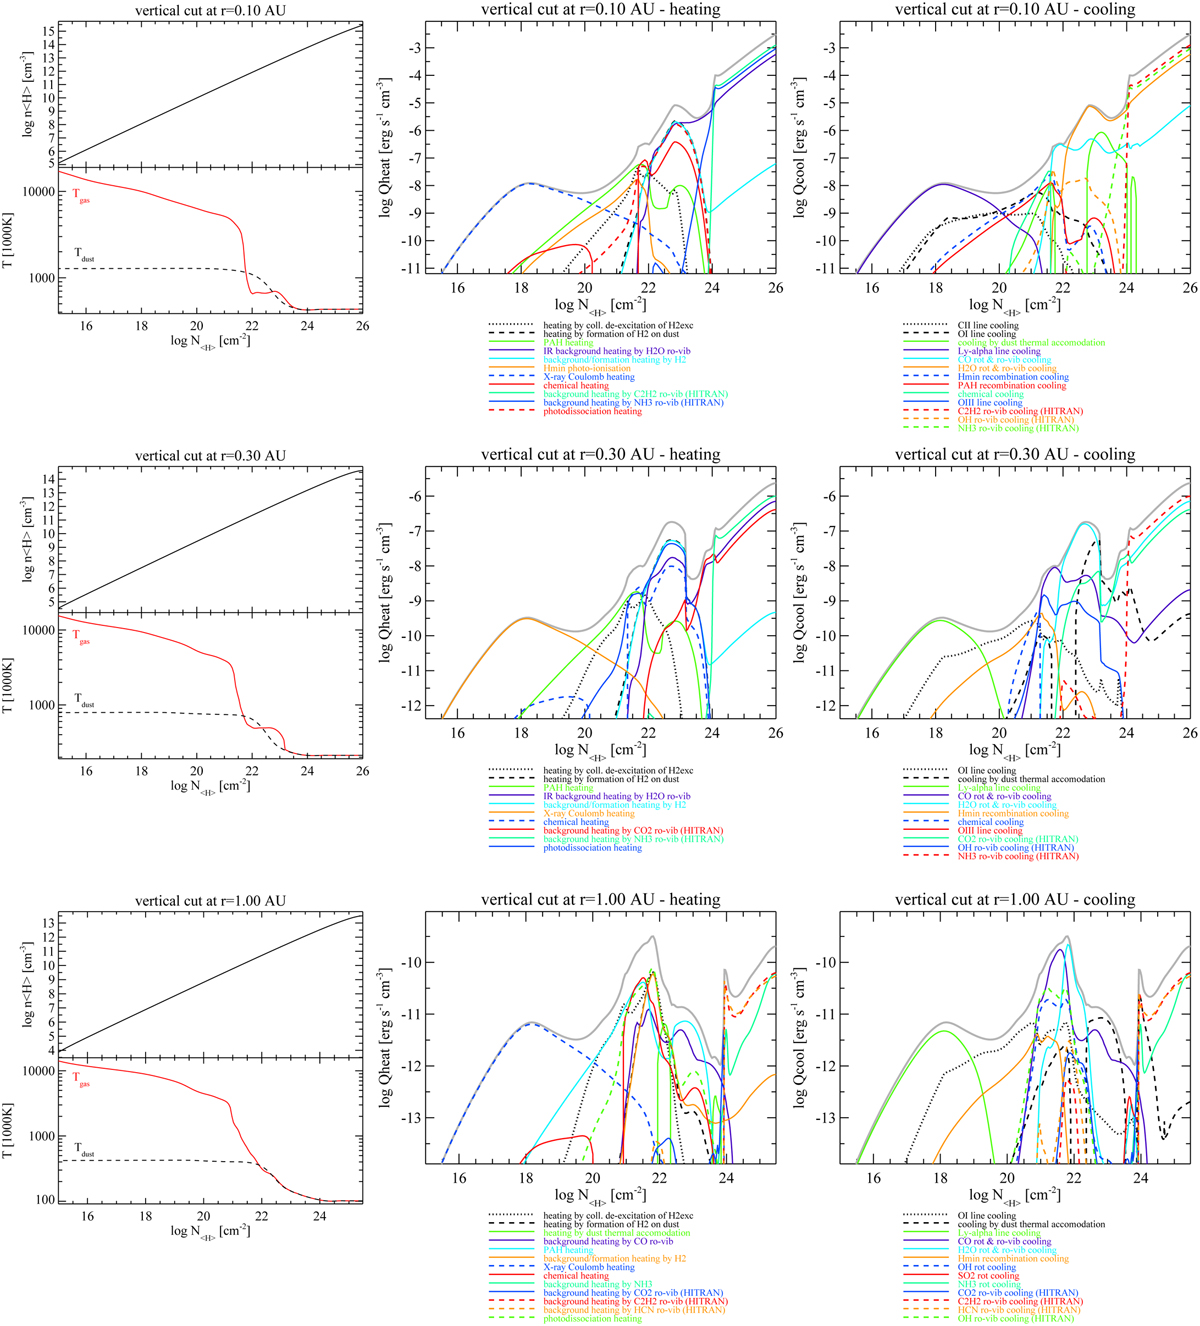
Fig. A.1
Download original image
Vertical cuts at r = 0.1 au, 0.3 au, and 1 au through the standard PRODIMO T Tauri disc model after the code modifcations described in Sect. refsec:CodeChanges. The x-axis is the hydrogen nuclei column density measured from the top, relevant line formation typically happens between about 1021 cm−2 and 1024 cm−2. The left plots show the assumed hydrogen nuclei particle density n〈H〉 and the calculated gas and dust temperatures. The middle and left plots show the relevant heating and cooling rates, annotated below, where the thick grey line is the total heating and cooling rate. We note that ![]() . An individual heating or cooling rate is plotted when it reaches at least 15% of the total heating and cooling rate anywhere in the depicted vertical range.
. An individual heating or cooling rate is plotted when it reaches at least 15% of the total heating and cooling rate anywhere in the depicted vertical range.
Current usage metrics show cumulative count of Article Views (full-text article views including HTML views, PDF and ePub downloads, according to the available data) and Abstracts Views on Vision4Press platform.
Data correspond to usage on the plateform after 2015. The current usage metrics is available 48-96 hours after online publication and is updated daily on week days.
Initial download of the metrics may take a while.