Fig. 11
Download original image
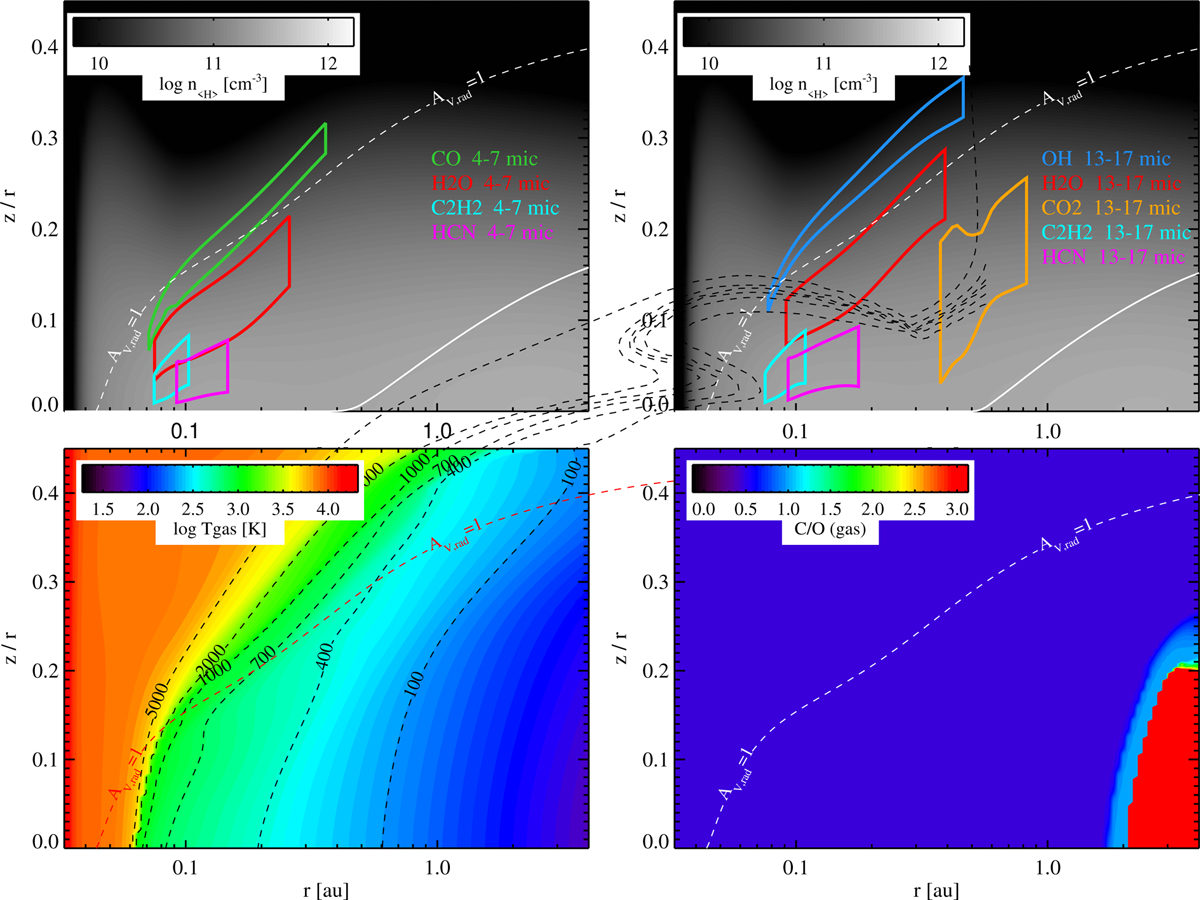
Location and physical properties in the MIR line-emission regions of the EX Lupi disc model. Upper row: Line-emitting regions of different molecules in two different spectral bands in the best-fitting EX Lupi model. The left upper plot considers λ = 4-07 µm, and the right upper plot λ = 13-17 µm. The white lines at the bottom of the plots mark the location where the vertical continuum optical depth is one, considering an average of the wavelengths of all water lines in the considered wavelength region. The bottom row shows the corresponding gas temperatures (left) and the carbon-to-oxygen ratio C/O in the gas phase (right). C/O = 0.46 is constant by assumption, except for the region where water ice is found to be stable, where C/O instantly jumps to very large values of >1000.
Current usage metrics show cumulative count of Article Views (full-text article views including HTML views, PDF and ePub downloads, according to the available data) and Abstracts Views on Vision4Press platform.
Data correspond to usage on the plateform after 2015. The current usage metrics is available 48-96 hours after online publication and is updated daily on week days.
Initial download of the metrics may take a while.