Fig. 10
Download original image
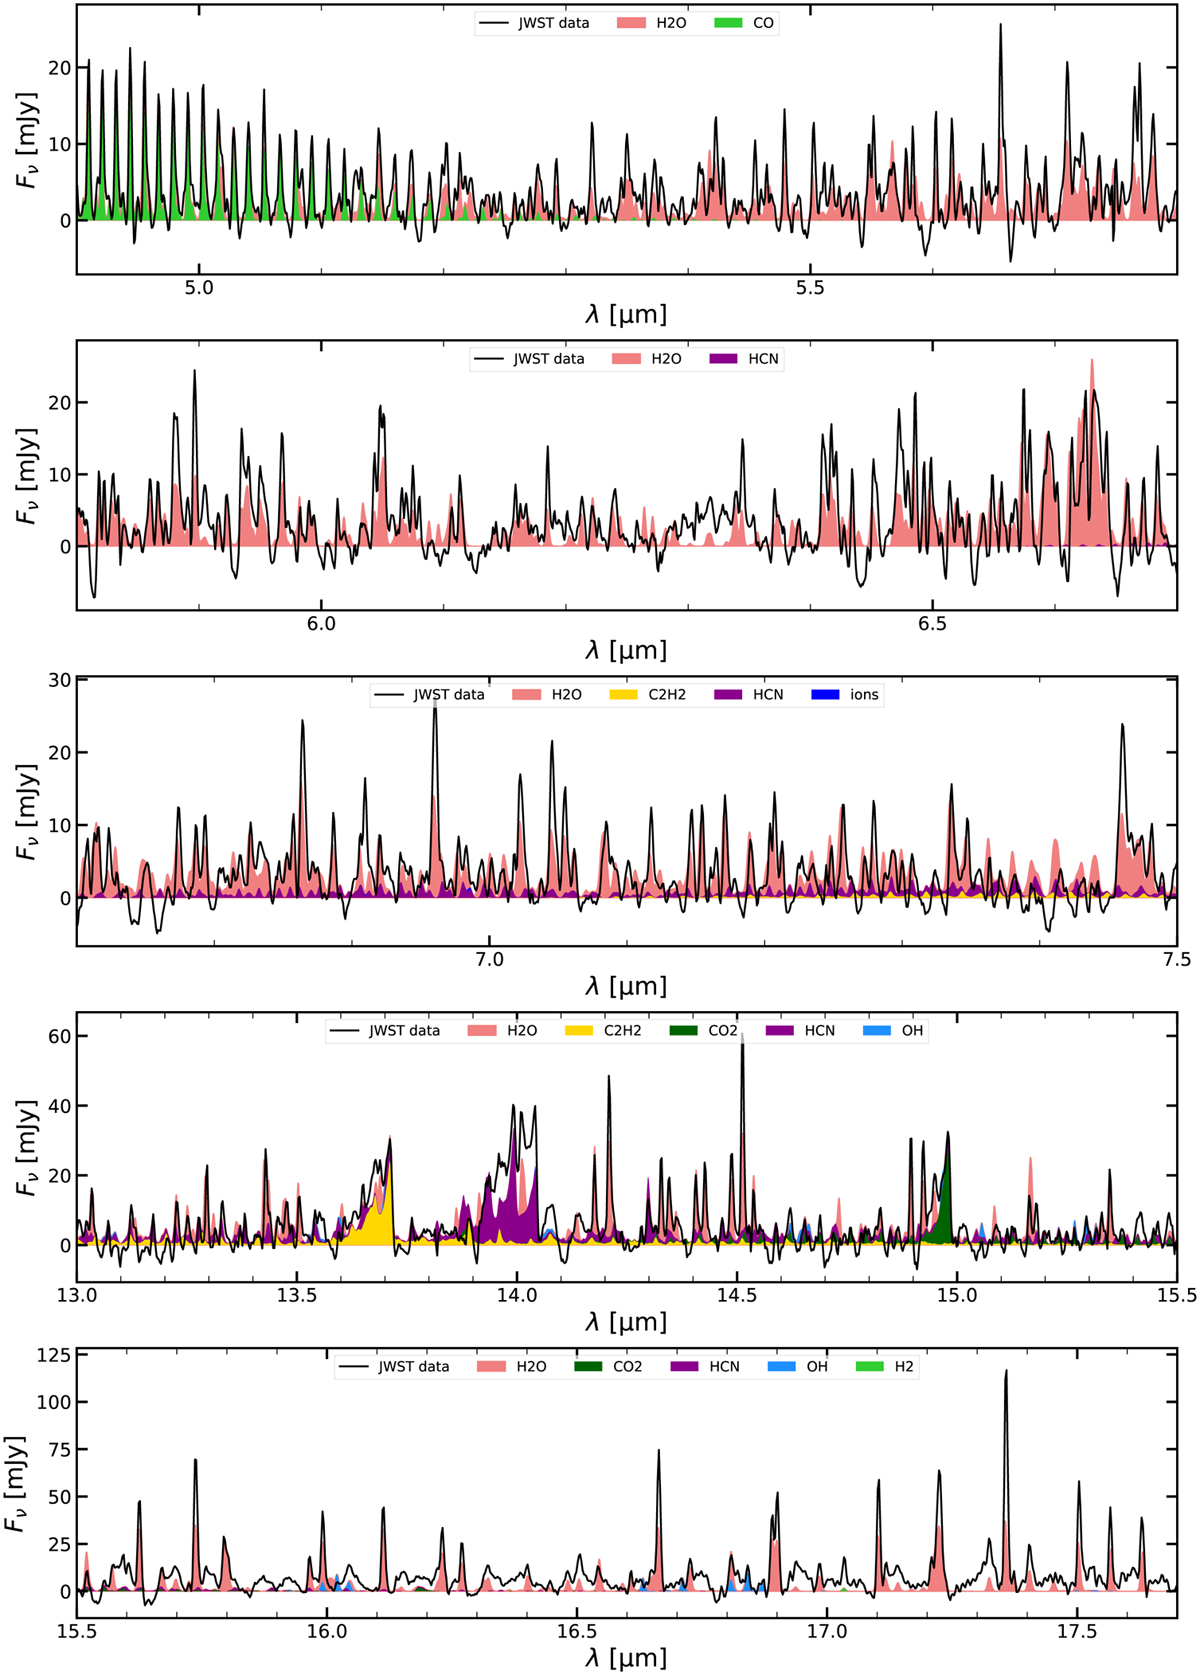
Continuum-subtracted JWST spectrum (black line) in comparison to the PRODIMO-FLITS disc model for EX Lupi. The coloured areas show the contributions of the different molecules to the total model line spectrum. These are therefore cumulative; i.e. the CO2-spectrum is plotted on top of the C2H2-spectrum, the HCN-spectrum on top of the (C2H2+CO2)-spectrum, and so on, such that the top of the water spectrum represents the total continuum-subtracted model spectrum. The model spectrum has been convolved to R = 2500. Furthermore, both the observational data and the model spectrum were slightly box-filtered before plotting in order to increase clarity; see main text. The broad bumps in the observational data (e.g. those around 6.3 µm and in the region 15.5 – 17.7 µm) are likely due to problems with the early data reduction and continuum subtraction.
Current usage metrics show cumulative count of Article Views (full-text article views including HTML views, PDF and ePub downloads, according to the available data) and Abstracts Views on Vision4Press platform.
Data correspond to usage on the plateform after 2015. The current usage metrics is available 48-96 hours after online publication and is updated daily on week days.
Initial download of the metrics may take a while.