| Issue |
A&A
Volume 683, March 2024
|
|
|---|---|---|
| Article Number | A58 | |
| Number of page(s) | 9 | |
| Section | Extragalactic astronomy | |
| DOI | https://doi.org/10.1051/0004-6361/202347724 | |
| Published online | 06 March 2024 | |
A search for high-redshift direct-collapse black hole candidates in the PEARLS north ecliptic pole field
1
Observational Astrophysics, Department of Physics and Astronomy, Uppsala University, Box 516 751 20 Uppsala, Sweden
e-mail: This email address is being protected from spambots. You need JavaScript enabled to view it.
2
Center for Astrophysics | Harvard & Smithsonian, 60 Garden St., Cambridge, MA 02138, USA
3
School of Earth and Space Exploration, Arizona State University, Tempe, AZ 85287-1404, USA
4
Space Telescope Science Institute, 3700 San Martin Drive, Baltimore, MD 21218, USA
5
Association of Universities for Research in Astronomy (AURA) for the European Space Agency (ESA), STScI, Baltimore, MD 21218, USA
6
Department of Physics, 366 Physics North MC 7300, University of California, Berkeley, CA 94720, USA
7
Jodrell Bank Centre for Astrophysics, Alan Turing Building, University of Manchester, Oxford Road, Manchester M13 9PL, UK
8
International Centre for Radio Astronomy Research (ICRAR) and the International Space Centre (ISC), The University of Western Australia, M468, 35 Stirling Highway, Crawley, WA 6009, Australia
9
ARC Centre of Excellence for All Sky Astrophysics in 3 Dimensions (ASTRO 3D), Australia
10
Department of Astronomy/Steward Observatory, University of Arizona, 933 N Cherry Ave, Tucson, AZ 85721-0009, USA
11
National Research Council of Canada, Herzberg Astronomy & Astrophysics Research Centre, 5071 West Saanich Road, Victoria, BC V9E 2E7, Canada
12
INAF – Osservatorio Astronomico di Trieste, Via Bazzoni 2, 34124 Trieste, Italy
13
Minnesota State University-Mankato, Telescope Science Institute, TN141, Mankato, MN 56001, USA
14
Department of Physics and Astronomy, University of Missouri, Columbia, MO 65211, USA
15
Instituto de Física de Cantabria, Edificio Juan Jordá, Avenida de los Castros s/n, 39005 Santander, Cantabria, Spain
16
Instituto de Física de Cantabria (CSIC-UC), Avenida Los Castros s/n, 39005 Santander, Spain
17
Chinese Academy of Sciences, National Astronomical Observatories, CAS, Beijing 100101, PR China
18
Department of Astronomy, The University of Texas at Austin, 2515 Speedway, Stop C1400, Austin, TX 78712, USA
19
Physics Department, Ben-Gurion University of the Negev, PO Box 653 Beer-Sheva 8410501, Israel
20
European Space Agency (ESA), European Space Astronomy Centre (ESAC), Camino Bajo del Castillo s/n, 28692 Villanueva de la Cañada, Madrid, Spain
21
Department of Physics, Montana State University, PO Box 173840 Bozeman, MT 59717, USA
22
Swedish Collegium for Advanced Study, Linneanum Thunbergsvägen 2, 752 38 Uppsala, Sweden
23
Mitchell Institute for Fundamental Physics and Astronomy, Texas A&M University, College Station, TX 77843, USA
24
NASA Marshall Space Flight Center, Huntsville, AL 35812, USA
Received:
14
August
2023
Accepted:
12
December
2023
Abstract
Direct-collapse black holes (DCBHs) of mass ∼104 − 105 M⊙ that form in HI-cooling halos in the early Universe are promising progenitors of the ≳109 M⊙ supermassive black holes that fuel observed z ≳ 7 quasars. Efficient accretion of the surrounding gas onto such DCBH seeds may render them sufficiently bright for detection with the JWST up to z ≈ 20. Additionally, the very steep and red spectral slope predicted across the ≈1 − 5 μm wavelength range of the JWST/NIRSpec instrument during their initial growth phase should make them photometrically identifiable up to very high redshifts. In this work, we present a search for such DCBH candidates across the 34 arcmin2 in the first two spokes of the JWST cycle-1 PEARLS survey of the north ecliptic pole time-domain field covering eight NIRCam filters down to a maximum depth of ∼29 AB mag. We identify two objects with spectral energy distributions consistent with theoretical DCBH models. However, we also note that even with data in eight NIRCam filters, objects of this type remain degenerate with dusty galaxies and obscured active galactic nuclei over a wide range of redshifts. Follow-up spectroscopy would be required to pin down the nature of these objects. Based on our sample of DCBH candidates and assumptions on the typical duration of the DCBH steep-slope state, we set a conservative upper limit of ≲5 × 10⁻⁴ comoving Mpc−3 (cMpc−3) on the comoving density of host halos capable of hosting DCBHs with spectral energy distributions similar to the theoretical models at z ≈ 6 − 14.
Key words: stars: black holes / stars: Population II / stars: Population III / quasars: supermassive black holes / early Universe / infrared: general
© The Authors 2024
 Open Access article, published by EDP Sciences, under the terms of the Creative Commons Attribution License (https://creativecommons.org/licenses/by/4.0), which permits unrestricted use, distribution, and reproduction in any medium, provided the original work is properly cited.
This article is published in open access under the Subscribe to Open model. This email address is being protected from spambots. You need JavaScript enabled to view it. to support open access publication.
1. Introduction
In the history of the Universe, the evolution of galaxies and supermassive black holes (SMBHs) are tightly connected. More than 200 quasars powered by SMBHs of mass ≳109 M⊙ have been discovered at redshift z ≳ 6 (e.g. Fan et al. 2001, 2003, 2023; Mortlock et al. 2011; Wu et al. 2015; Bañados et al. 2018; Yang et al. 2020; Wang et al. 2021), with some of them shining when the age of the Universe was less than 800 Myr. Explaining how black holes reach such masses this early in the history of the Universe is challenging and requires some combination of highly efficient gas accretion and black hole mergers (Pacucci & Loeb 2020) starting from lower-mass (∼102 − 106 M⊙) black hole seeds (see, e.g., Woods et al. 2019; Inayoshi et al. 2020; Fan et al. 2023, for recent reviews). Thus, the discovery of high-redshift SMBHs is instrumental in constraining the properties of the seed population of black holes (Pacucci & Loeb 2022).
Several formation mechanisms for such seeds have been proposed in the literature. These include (i) primordial formation during inflation or from cosmic string loops (e.g., Hasinger 2020; ii) formation as the end product of massive and metal-free stars, possibly undergoing super-Eddington accretion episodes (e.g. Begelman 1978; Wyithe & Loeb 2012; Begelman & Volonteri 2017); (iii) formation through runaway stellar mergers in young star clusters (e.g. Portegies Zwart & McMillan 2002; Davies et al. 2011; Katz et al. 2015; Boekholt et al. 2018); and (iv) formation via direct-collapse black holes (DCBHs; Loeb & Rasio 1994; Bromm & Loeb 2003; Lodato & Natarajan 2006; Pacucci et al. 2017a; Inayoshi et al. 2020; Volonteri et al. 2021).
In the DCBH scenario, gas within an atomic-cooling halo (i.e., ≳107 M⊙) collapses to form a ∼104 − 106 M⊙ (Ferrara et al. 2014) black hole at z ∼ 20 − 30 (e.g. Loeb & Rasio 1994; Bromm & Loeb 2003; Lodato & Natarajan 2006), possibly with a supermassive star or a quasi-star formed as an intermediate step (see Woods et al. 2019, for a review). Accretion onto the newly formed seed black hole from the surrounding gas in duty cycles with active phases lasting up to ≈100 Myr (e.g. Pacucci et al. 2015) could render such a DCBH sufficiently luminous to allow detection at z > 7 either in the near-to-mid infrared (IR) or in the X-ray regime. The high-energy emission is more sensitive to details of the accretion process, such as the gas metallicity and column density of the host galaxy (Pacucci et al. 2015, 2016). Current X-ray observatories, such as Chandra, have deep-field sensitivity limits of ∼10−17 erg s−1 cm−2 that render most of the seed population undetectable. Proposed X-ray probe-class missions, such as AXIS, could reach sensitivities of ∼10−18 erg s−1 cm−2 in their deep fields, allowing the uncovering of at least part of the population of seeds, especially in the heavy regime. In the deepest James Webb Space Telescope (JWST) exposures, DCBHs of initial mass ∼105 M⊙ may remain detectable up to z ≈ 20 (Natarajan et al. 2017; Whalen et al. 2020) if supplied with large accretion rates from their host.
The likely observable signatures of DCBHs through JWST observations vary significantly, largely due to various factors as discussed in the literature (Pacucci et al. 2015, 2016; Natarajan et al. 2017; Valiante et al. 2017, 2018; Visbal & Haiman 2018; Whalen et al. 2020; Inayoshi et al. 2022; Nakajima & Maiolino 2022). These factors include (i) the evolutionary state of the objects, including factors such as the initial seed mass, gas density, and metallicity of the host, as well as gas availability; (ii) the details of the accretion process onto the seed (e.g., the geometry of the disk and its radiative efficiency); (iii) the triggering of star formation in the host, possibly enhanced by soft X-ray irradiation from the DCBHs; and (iv) the merger history of DCBHs after formation.
Some models suggest that the light from the DCBH is likely to be blended with that of surrounding stars and associated nebular emission (Natarajan et al. 2017). This occurs either because the DCBH forms in the direct vicinity of star-forming halos (which provides the radiation required to deplete molecules in the DCBH host and prevent cooling) and merges with these on timescales as short as ∼1 Myr (e.g. Pacucci et al. 2017a; Natarajan et al. 2017), or because star formation occurs within the DCBH host halo itself (e.g. Aykutalp et al. 2014, 2020; Valiante et al. 2018; Barrow et al. 2018). In other scenarios, the DCBH can remain isolated for prolonged periods while efficiently growing in mass due to cold accretion (Whalen et al. 2020; Latif et al. 2022).
Consequently, the anticipated photometric spectral energy distributions (SEDs) of high-redshift DCBHs, spanning the wavelength range probed by JWST exhibit a spectrum ranging from blue (e.g. Valiante et al. 2018; Barrow et al. 2018) to red (e.g. Pacucci et al. 2016; Whalen et al. 2020; Inayoshi et al. 2022). The predicted formation rates of DCBHs as a function of redshift are also highly variable, mainly due to uncertainties in the level of background radiation necessary to prevent star formation and the effect of supernova feedback (Habouzit et al. 2016). Theoretical predictions on the comoving number densities of halos capable of hosting DCBHs span over five orders of magnitude at any given redshift (Habouzit et al. 2016; Valiante et al. 2017), rendering estimates of DCBH detectability with JWST highly uncertain (e.g., Pacucci et al. 2019).
This work presents a photometric search for z ≳ 6 DCBH candidates in the Prime Extragalactic Areas for Reionization and Lensing Science (PEARLS) north ecliptic pole (NEP) field for which auxiliary X-ray data are available. In particular, we focus on the predictions of Pacucci et al. (2016) in which DCBHs, at birth, exhibit very steep (i.e., “red”) SEDs within the wavelength range of ≈1 − 5 μm probed by JWST/NIRCam. These SED models allow us to efficiently sift out promising candidates with current JWST observations because of the large change in flux between the near-to-mid IR filters.
A previous search by Pacucci et al. (2016) for such red DCBH candidates at z ≲ 10 using data from the Hubble Space Telescope (HST), Spitzer, and Chandra revealed that objects at H < 27 AB mag exhibiting the relevant ≈1 − 5 μm signatures of ∼104 − 106 M⊙ DCBHs do exist but are very rare. However, this candidate selection was based on three broadband filters only in the range of 1−5 μm. Given the superior depth and more diverse set of photometric filters provided by JWST, it remains unclear how many of such candidates will remain consistent with a DCBH interpretation after further scrutiny.
The current work is organized as follows. In Sect. 2, we present the PEARLS data used, while Sect. 3 provides a description of the selection criteria upon which our search is based. In Sect. 4, we present our main results: our DCBH candidates and the inferred upper limits on the comoving number density of DCBH host halos. Our findings are discussed and summarized in Sect. 5.
2. JWST/NIRCam data on the NEP field
The IR observations analyzed in this study were provided as a part of the PEARLS (PI: R. Windhorst; Windhorst et al. 2023) Guaranteed Time Observations (GTO) program. PEARLS is a time-domain survey of the NEP field that is being carried out in four “spokes” (Jansen & Windhorst 2018) covering a total survey area of 68 arcmin2 (i.e., 17 arcmin2 for each spoke as a 2 × 1 mosaic layout of NIRCam modules A and B; Rieke et al. 2023). The NEP time-domain field, centered at RA 17:22:47.896 and Dec +65:49:21.54, is within the JWST continuous viewing zone and has been imaged by the NIRCam in eight near-IR bands using four short-wavelength (SW) filters (F090W, F115W, F150W, and F200W) and four long-wavelength (LW) filters (F277W, F356W, F410M, and 444W) with 5σ detection limits at 28−29 AB mag. The auxiliary data for this field contains observations spanning a broad energy range from radio to X-ray (see Windhorst et al. 2023, for additional details). In this work, we used spoke 1 and spoke 2 data catalogs covering a total area of 34 arcmin2 and including ≈24 120 objects.
The catalogs were created following the methodology outlined in Windhorst et al. (2023), with the only significant difference being the retention of point sources, as it is possible that DCBHs remain unresolved. In short, Source Extractor (Bertin & Arnouts 1996) was utilized for source detection on 30 milli-arcsecond pixel-scale mosaics astrometrically aligned to Gaia DR3 and with weight maps employed to aid in the detection and to account for flux uncertainties. The dual-image mode was employed, with the F444W image used for source detection and aperture definition. The minimum threshold for analysis and detection was set at 1.5σ in nine connected pixels, while the deblending contrast parameter was set to 0.06 to strike a balance between completeness and reliability. All measured fluxes used Source Extractor’s “automatic” apertures (i.e., MAG_AUTO).
Additionally, another important dataset in our search for z > 6 DCBH candidates was the NuSTAR 3−24 keV and Chandra 0.5−7 keV X-ray observations. We used the dataset to select X-ray bright candidates (see Sect. 4.3).
3. Photometric signatures of direct-collapse black holes at z ≳ 6
High-redshift accreting DCBHs that are surrounded by a sufficiently dense reservoir of gas are Compton-thick (i.e., they have a column density nH > 1.5 × 1024 cm−2) and can display a very red SED for prolonged periods of time at rest-frame ultraviolet and optical wavelengths (Pacucci et al. 2016). This serves as a photometric signature across the 1−5 μm range that is probed by JWST/NIRCam at z ≳ 6. In this phase of evolution, the DCBH may also be detectable in the X-ray regime, although the X-ray flux is highly model dependent and can lie below the detection threshold of all current X-ray telescopes (Pacucci et al. 2015), except during the brightest phases of accretion.
In Fig. 1, we plot the SED of the Pacucci et al. (2016) 5 × 10⁶ M⊙ DCBH model at z = 6 − 20 against the PEARLS JWST/NIRCam detection limits. As can be seen, this model remains detectable in at least four JWST/NIRCam filters until z = 20 and displays a very red spectral slope.
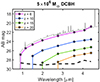 |
Fig. 1. DCBH detection limits in the NEP. The thick dashed line represents the combined JWST/NIRCam 5σ flux detection limits expressed in AB magnitudes across the NEP spokes. The colored lines show the photometric fluxes of the Pacucci et al. (2016) 5 × 10⁶ M⊙ DCBH model at z = 6, 10, 15, and 20 in the set of NIRCam filters used by PEARLS across the NEP field. The thin solid black line shows the z = 6 version of the DCBH model spectrum on which the photometric predictions are based, but offset by 0.5 mag for clarity. As can be seen, this Pacucci et al. (2016) 5 × 10⁶ M⊙ DCBH model remains detectable up to z = 20 in the reddest NIRCam filters used. The photometric SEDs are characterized by a significantly red slope across the NIRCam bands and are relatively featureless except for the drop at the Lyα limit and the bump seen in the F444W filter at z = 6 SED, which is due to strong Hα emission. This is not seen in the higher-redshift SEDs, since it redshifts out of the NIRcam range at z ≳ 6.9. |
While this significantly red SED ensures that DCBHs stand out from the majority of z ≳ 6 objects, it also presents a number of challenges. The intrinsically red slope of the SED can, in fact, make it difficult to assess the wavelength of the Lyman-α (Lyα) break since the flux in the filter covering wavelengths directly longward of the “dropout” filter may also fall below the detection threshold in the case of faint DCBHs. As a reminder, the Lyα break renders the flux at wavelengths ≲0.1216 (1 + z) μm undetectably low due to absorption in the neutral intergalactic medium for light sources at z ≳ 6 and is often used to determine the redshift. The situation is illustrated in Fig. 2, where we show that DCBHs over a relatively large redshift range (Δ(z)≈4) can produce photometric SEDs that are observationally indistinguishable given the NEP detection limit.
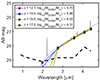 |
Fig. 2. Mass-redshift degeneracy for DCHB SEDs without a clear-cut Lyα break. If the Lyα break is close to or below the detection threshold (dashed black line), acceptable SED fits to NIRCam data at longer wavelengths can be achieved for DCBH models over a wide range of redshifts. Here, the purple line corresponds to the photometric SED of a z = 12.7 DCBH with mass log10(MDCBH/M⊙) = 5.70, and the thin solid line is the corresponding spectrum (offset by 0.1 mag for clarity). In this case, the Lyα break occurs at ≈1.7 μm between the F150W and F200W filters. While the F200W flux is largely unaffected by the Lyα break, the red slope of the DCBH SED still places the F200W flux below the detection limit of the NEP field. Since a sharp drop in flux at the Lyα limit becomes unobservable in this case, the redshift becomes poorly constrained as higher-mass DCBH models at z = 14 (blue line), z = 16 (green line), and z = 17 (orange line) produce very similar fluxes in the longer-wavelength NIRCam filters (F277W, F356W, F410M, and F444W). |
A second challenge comes from the fact that the relatively featureless photometric SEDs of the Pacucci et al. (2016) DCBHs may be confused with other rare types of objects. Low-temperature stars or substellar objects in the Milky Way could appear as very red point sources, and in some cases, they can potentially be confused with compact objects at high redshifts. However, the detailed JWST/NIRSpec SEDs of our DCBH models at z = 5 − 20 do not match the SEDs of any of the faint star or brown dwarf models in the sets of Baraffe et al. (2015) and Phillips et al. (2020), and such objects are therefore unlikely to be confused with DCBHs in the current search. Dusty galaxies and obscured active galactic nuclei (AGN) are more likely to be interlopers, and in Fig. 3 we show that even when imaging in the eight NIRCam filters is available, the photometric signatures of DCBHs may be reproduced by both of these types of objects. When only parts of the NIRCam wavelength range are probed (i.e., when colors featuring just a few of the NIRCam wide-band filters are used as diagnostics), DCBHs may also display colors similar to some of the very reddest objects detected so far by JWST, including AGN candidates and so-called HST-dark galaxies (Rodighiero et al. 2023; Furtak et al. 2023; Larson et al. 2023; Barrufet et al. 2023; Kokorev et al. 2023; Barro et al. 2023; Matthee et al. 2023; Labbe et al. 2023; Smail et al. 2023). For example, Kocevski et al. (2023) have reported on the discovery of a broad-line AGN at z ≈ 5.6, which at ≈2 − 4.4 μm displays a steep and red SED very similar to our DCBH models, whereas the ≈1.15 − 1.5 part is relatively flat in fν units (many similar SEDs have also been seen in Barro et al. 2023; Labbe et al. 2023). In its entirety, this type of SED would not allow for a good fit to our DCBH models, but if the source had been intrinsically fainter so that the short-wavelength part had fallen below the detection threshold, our search procedure would probably have identified this SED as a likely DCBH.
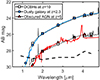 |
Fig. 3. Photometric degeneracy between high-z DCBHs, obscured AGN, and very dusty galaxies. The thin black lines represent the Pacucci et al. (2016) model spectra of DCBHs with mass 5 × 10⁶ M⊙ (upper line) and 5 × 10⁵ M⊙ (lower line) at z = 10. The white squares indicate the corresponding integrated fluxes in the NIRCam filters used in the PEARLS/NEP survey. While the detailed spectra of the DCBHs display features that would set them apart from both dusty galaxies and obscured AGN, their photometric properties can be relatively well reproduced by both of these types of objects. The blue line represents the model spectrum of a passively evolving, very dusty (AV ≈ 2.5 mag, Z = 0.004, age ≈2 Gyr) galaxy at z = 2.3 based on the Zackrisson et al. (2011a) set, with filter fluxes (blue squares) that can roughly reproduce the photometric data points of the 5 × 10⁶ M⊙ DCBHs that lie above the PEARLS/NEP detection threshold (dashed black line). The red line and red triangles represent the Polletta et al. (2007) template spectrum and its corresponding NIRCam filter fluxes for an obscured AGN (QSO2 template), redshifted to z = 5 and scaled to match the 5 × 10⁵ M⊙ DCBH model as closely as possible. Also in this case, there is a substantial similarity in the photometric SED between the z = 5 AGN and the z = 10 DCBH. |
This means that all photometrically selected DCBH candidates should be considered tentative until confirmed through spectroscopy, as discussed in Sect. 5. In Appendix A, we provide some further exploration of the properties of galaxies capable of mimicking the SEDs of DCBHs.
4. Direct-collapse black hole candidates
To produce a grid of SED models for DCBHs against which the objects in the PEARLS/NEP catalogs are tested, we started from the Pacucci et al. (2016) models of a DCBH with a seed mass around 105 M⊙, and we extracted SEDs at times where the black hole mass has grown to MDCBH = 5 × 10⁵, 1 × 10⁶, 5 × 10⁶, and 7 × 10⁶ M⊙. These four original DCBH model spectra were then interpolated to form 50 DCBH spectra uniformly spaced in log10 MDCBH throughout the 5 × 10⁵ − 7 × 10⁶ M⊙ range. On this basis, we derived photometric fluxes in the relevant NIRCam filters at z = 5 − 15 with a step size of Δ(z) = 0.1. We assumed a cosmology characterized by ΩM = 0.32, ΩΛ = 0.68, and H0 = 67 km s−1 Mpc−1, as well as complete absorption by the neutral intergalactic medium at rest wavelengths shorter than Lyα for sources at z > 5.8.
4.1. Direct-collapse black hole candidate selection
The search for potential DCBH candidates among the 24 119 objects listed in PEARLS/NEP1+NEP2 catalog began by selecting observations with at least four detected fluxes above the JWST NIRCam 2σ detection limit (see Sect. 2). For fluxes associated with unrealistically small error bars, such as < 0.1 mag, we capped both upper and lower error bars at 0.1 mag. An SED fitting using reduced-χ2 ( ) minimization was then performed for every catalog object using all the Pacucci et al. (2016) DCBH models described above. Consequently, two sources with IDs 21 567 and 22 802 revealed acceptable fits with
  (hereafter, we refer to the two DCBH candidates as DCBH-1 and DCBH-2, designated in arbitrary order). Based on the minimum and maximum degrees of freedom (two and six), the corresponding limits of the P-values for the selected
  range are 0.049 and 0.006. Therefore, considering a maximum
  of three is quite generous for this analysis and ensures that the upper limits on the comoving density of DCBH host halos in Sect. 4.2 are conservative. The fit parameters and the source information of all detections are listed in Table 1. In the case of DCBH-1, it appeared that the obtained mass (log10(M/M⊙) = 5.56) falls below the range covered by our models. This happens because we chose to expand our model dataset by employing an extrapolation technique. We included additional models that were derived through interpolation, where we closely examined observed data points and created new models to fill in the gaps. By doing so, we significantly enhanced both the overall coverage, which means a broader range of scenarios, and the granularity within our model set. The mass of DCBH-1 was therefore scaled down in this process. Thumbnail images and SED fits of the two candidates are shown in Fig. 4.
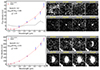 |
Fig. 4. DCBH candidates in PEARLS/NEP. In the left column, we show the JWST/NIRCam photometric fluxes in eight bands (blue dots) and the corresponding best-fitted photometric DCBH models (red dots and solid line) from Pacucci et al. (2016). The dashed lines correspond to NIRCam detection limits. In the right columns, we show the corresponding 2 × 2 arcsec images for the objects DCBH-1 (top) and DCBH-2 (bottom). Tabulated fluxes and coordinates of these objects are listed in Table 1. |
Selected sources and corresponding best-fit parameters obtained with the z > 6 DCBH models (Pacucci et al. 2016).
As expected, the photometric SEDs exhibit extremely red continuum slopes through the NIRCam bands. At the flux levels of these candidates, the first data point at wavelengths longward of the Lyα limit lies too close to the NEP detection threshold to allow a sharp Lyα limit feature to be seen (unlike in the z = 6 and z = 10 examples shown in Fig. 1). Instead, the continuum gradually fades below the detection limit, which unfortunately makes the redshift difficult to constrain. These photometric signatures may also be reproduced by obscured AGN or very dusty galaxies (see Sect. 3 and Fig. A.1).
We note that there is a range of morphologies among these sources, with one of the candidates being extended and one being more point-like. Naively, one would expect DCBHs to appear as unresolved point sources, but the presence of ionized gas surrounding the DCBH and/or its proximity to a nearby galaxy could also be consistent with an extended source. However, one should note that if the extended source is indeed a galaxy, the Pacucci et al. (2016) DCBH SED fitting method will not yield accurate results.
Shifting focus to a different aspect of the sources, it is noteworthy that the Eddington ratios in the models we used consistently demonstrate a slightly super-Eddington behavior (as elucidated in Fig. 1 of Pacucci et al. 2015). This characteristic is particularly evident in our two candidates, DCBH-1 and DCBH-2, which have estimated Eddington ratios of 3.1 and 1.5, respectively, at the time of observation. Notably, the estimate for the luminosity emitted by the black hole in GN-z11, the farthest detected to date (Maiolino et al. 2024), is about five times its Eddington luminosity.
4.2. The comoving density of direct-collapse black holes
The prospects of detecting DCBHs in a given survey are set by a combination of two factors: (i) the flux detection limits of the photometric and/or spectroscopic observations used and (ii) the sky area covered by a survey. Whereas the flux detection thresholds set limits on the properties of the observable DCBHs (in terms of black hole mass, accretion rate, etc.), the survey area determines the number of such objects that are included in the survey.
The connection between the survey area and the expected number of DCBH detections is further complicated by substantial uncertainties regarding the properties required for DCBHs to form. Theoretical predictions on the number density of halos that could host DCBHs at z = 6 − 20 spans at least five orders of magnitude at any given redshift (Habouzit et al. 2016; Valiante et al. 2017; Inayoshi et al. 2020).
To compare current predictions on the number density of DCBH host halos to the number density that would allow for at least one detection in PEARLS, we derived the comoving number density nhosts of host halos that would produce a certain number of observed DCBH candidates (Nobs) in the Δ(z) interval centered around redshift z as
 (1)
(1)
where Vc(A, z, Δ(z)) is the comoving volume probed by a survey that covers an area A in the sky across Δ(z) at redshift z, Δtz, Δ(z) is the cosmic time interval spanned by Δ(z) at this redshift, and ΔtDCBH is the total time interval during which a DCBH can be expected to exhibit some specific set of selection criteria.
In the case of the NEP, we based the Vc(A, z, Δ(z)) estimate on a survey area for two spokes (see below) and evaluated Eq. (1) in Δ(z) = 1 bins. As long as ΔtDCBH < Δtz, Δ(z), nhosts can be interpreted as the comoving number density of DCBH host halos emerging within a single redshift bin, which roughly corresponds to theoretical predictions on noncumulative densities of DCBH host halos (e.g. Habouzit et al. 2016).
By requiring DCBH candidates to be detectable in at least four JWST/NIRCam filters, the maximum redshift for which DCBHs may be detected throughout the full 0.5 − 7 × 10⁶ M⊙ mass range considered corresponds to z ≈ 14 when using PEARLS data for the NEP field. By comparison, other JWST cycle-1 surveys such as the Cosmic Evolution Early Release Science (CEERS1; ≈100 arcmin2 in the Extended Groth Strip; Finkelstein et al. 2022) and the JWST Advanced Deep Extragalactic Survey (JADES2; ≈175 arcmin2 in GOODS-S and GOODS-N; Eisenstein et al. 2023), which have somewhat deeper detection limits, have the potential to extend this limit to z ≈ 16 and 19, respectively.
By setting Nobs = 1 in Eq. (1), Fig. 5 displays the minimum DCBH host halo number densities detectable in PEARLS NEP, CEERS, and JADES as a function of redshift under the assumption that 0.5 − 7 × 10⁶ M⊙ DCBHs retain their Pacucci et al. (2016) telltale spectral signatures for ΔtDCBH = 10 Myr.
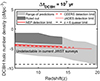 |
Fig. 5. Detection limits on the number density of halos that may host DCBHs as a function of redshift. The light-gray region represents the approximate range of theoretical predictions of the comoving number densities of halos that may host DCBHs, based on the compilation by Habouzit et al. (2016). The red lines represent the lowest detectable host halo comoving density in the case of a DCBH that remains sufficiently bright for detection in at least four JWST/NIRCam filters and retains its characteristic spectral signatures for 10 Myr given the total survey areas of PEARLS NEP (four spokes; solid red line), CEERS (dashed red) and JADES (dotted red). The part of the parameter space ruled out by the current limit derived in this paper is marked by the dark-gray region. The dashed black line represents the approximate z = 6 quasar number density DCBH models must exceed prior to these redshifts to explain the SMBH powering these objects. |
These detection limits were compared to the range of theoretical predictions on the comoving number densities of DCBH hosts from Habouzit et al. (2016). The DCBH models that fall above these limits could produce DCBH detections within the specified survey areas, whereas models falling below the limits would produce too few DCBHs per comoving volume to make detections likely.
Based on our analysis using PEARLS NEP1 and NEP2 observations, we found two potential sources at different redshifts (see Sect. 4.1 for details). Assuming Nobs = 2 and the PEARLS survey area of ∼34 arcmin2 for two spokes, the upper limit on the comoving density of halos that host DCBHs that have grown to 5 × 10⁵ − 7 × 10⁶ M⊙ and exhibit SEDs in accord with the Pacucci et al. (2016) models then becomes ≈1.5 − 5 × 10⁻⁴ cMpc−3 (“c” stands for comoving density; the lower part of the dark-gray region in Fig. 5) at z = 6 − 14. These limits are conservative since they were derived under the assumption that both candidates could potentially be located at any redshift in this range. We stress that the redshift estimates for the candidates obtained by Pacucci et al. (2016) are photometric and therefore subject to substantial uncertainties (as also discussed in Sect. 3).
These limits already exclude the upper part of the DCBH parameter space compiled by Habouzit et al. (2016) at these redshifts, and increasing the timescale over which the DCBHs are assumed to be detectable given our search criteria would strengthen the constraints even further. For example, increasing ΔtDCBH from 10 Myr to 100 Myr would shift both the upper limit and the theoretical detection limits of the various surveys down by 1 dex at z ≈ 6 − 8. At higher redshifts, the limits could potentially become even stronger, but scenarios of this type (with ΔtDCBH > Δtz, Δ(z) for Δ(z) = 1, causing DCBHs that form in higher-redshift bins to survive into lower-redshift bins) would result in upper limits that depend on the formation history of DCBH host halos specific to each formation model.
Since the predicted range of host number densities extends well above the detection limits of PEARLS/NEP, CEERS, and JADES, DCBH detections may be possible even if a small fraction of potential DCBH host halos would produce sources with the spectral characteristics we used for candidate selection. However, since the predicted range also extends below the detection limits, success in detecting DCBHs in these JWST surveys is not assured. In Fig. 5, we considered only number densities from the Habouzit et al. (2016) simulation scenarios that successfully generate DCBH candidate halos, not the Habouzit et al. (2016) simulation scenarios that failed to produce any such objects within the simulated volume. If the latter actually provides a better representation of reality, then the DCBH number density could in principle be even lower than what is shown in Fig. 5. However, if DCBHs serve as the primary seeds of early SMBHs, a hard lower limit can be set by considering the comoving number densities of z ≈ 6 quasars (∼10−9 cMpc−3; e.g., Valiante et al. 2017) since the DCBH host halo number density must then exceed this limit at some prior redshift.
4.3. Constraints on X-ray emission
In order to constrain the X-ray emission of our two candidates (see Fig. 4), we used the 1.3-megasecond Chandra observations available in the field. By using different extraction regions centered at each source position (the 50% encircled energy, 0.32 arcsec in all cases, and r = 1 arcsec) and 3″ − 5″ annulus for background extraction, we obtained nondetections for both of the candidates. In this case, we could compute 3σ upper limits on count rates of 1.7 × 10⁻⁶ count s−1, which translates into an upper limit on the observed flux of ∼3 × 10⁻¹⁷ erg s−1 cm−2 in the 0.5−7 keV band when assuming a power-law model with a spectral index of Γ = 1.4. This flux translates into an X-ray luminosity of ∼7 × 1043 in the 0.5−7 keV band at redshift z = 7. The XMM-Newton and NuSTAR data available in this field (Zhao et al. 2021) were also searched at the position of the two sources, and a consistent upper limit with Chandra was found. We note that the two DCBH candidates selected by Pacucci et al. (2016) are strong detections, with a full-band X-ray flux of ∼6 − 7 × 10⁻¹⁶ erg s−1 cm−2 calculated from 125 counts.
5. Discussion and conclusions
In this study, we conducted an observational search for DCBHs, which represent one of the proposed mechanisms for the formation of SMBHs. The DCBH scenario elucidates the process by which black holes achieved masses exceeding 109 M⊙ during the early stages of the Universe. With the launch of JWST, we now possess the capability to explore the depths of high redshifts and low luminosities, enabling us to delve into the past and investigate this phenomenon with unprecedented precision in the IR regime.
As we have shown, objects with photometric SEDs that closely resemble the Pacucci et al. (2016) predictions of z ≳ 6 DCBHs do exist, even in full eight-band JWST/NIRCam datasets of the type provided by the PEARLS/NEP survey. Consequently, two DCBH candidates, a point-like source, and an extended source were identified through SED fitting using the Pacucci et al. (2016) DCBH models (see Sect. 4.1 for details).
However, since a DCBH sample selected in this way may include heavily dust-reddened galaxies and AGN (see Sect. 3), additional data were required to ascertain the true nature of these objects. Given the ubiquity of dust-obscured AGN at z > 5 revealed by JWST (Kocevski et al. 2023; Greene et al. 2023), it is possible that DCBH candidates identified by our search criteria are in reality AGN for which the flatter part of the SED is simply hiding below the detection threshold in the shorter-wavelength filters. Follow-up spectroscopy is therefore required to elucidate the true nature of objects that display DCBH-like photometric SEDs.
The spectroscopic signatures of the DCBH models by Pacucci et al. (2016) include very strong hydrogen Balmer lines, an Hα-Hβ emission-line ratio of Hα/Hβ > 10 (i.e., in significant excess of the case B recombination value of ≈2.8 due to collisional pumping of Hα), a strong HeII1640 emission line, and an absence of emission lines due to metals (Pacucci et al. 2017b). At z ≳ 6.9, Hα redshifts out of the JWST/NIRSpec wavelength range, but it remains within reach of JWST/MIRI imaging and spectroscopy until z ≈ 15. Follow-up observations with NIRSpec and MIRI could therefore rule out both dusty starbursts and AGN, at least for the brightest of our candidates.
If the DCBH is located inside a large ionized bubble in the intergalactic medium (for instance because the formation of the DCBH has been triggered by a nearby AGN; e.g., Johnson & Aykutalp 2019), the Lyα line could also be partially transmitted. However, the transmission of a significant Lyα flux at z ≳ 6 would alter the photometric signature (e.g., Zackrisson et al. 2011b). The DCBH candidate selection in this work and by Pacucci et al. (2016) were made assuming a negligible Lyα contribution to the SED.
Due to stochastic gas accretion onto the black hole, DCBHs may also display brightness variations (Wang et al. 2017) and thus stand out in multi-epoch observations with NIRCam. While this makes DCBHs distinct from dusty galaxies (except in the rare case of a supernova going off in a star-forming galaxy), it does not, however, effectively separate DCBHs from AGNs.
The extended morphology evident in one of our candidates could arise from ionized gas around the DCBH, as shown in some early simulations. However, the morphological structure at least shortly after their formation process would be nearly spherical in this case, with a typical radius of 0.5 kpc (see, e.g., Latif et al. 2013). Specifically, DCBH-2 shows a somewhat extended morphology, with a maximum size of a few kiloparsecs. The size of the luminous, possibly ionized region depends on the frequency range observed by the filter, ranging from a fraction of a kiloparsec to a few kiloparsecs. Detailed simulations are needed to assess how the optical depth of this ionized region depends on the observed wavelength.
If the extended structure is not associated with the central DCBH, it must be caused by either the DCBH host galaxy or a nearby galaxy. However, an evident stellar component in the candidate’s image would substantially impact the SED, invalidating the use of DCBH models without accounting for the galaxy contribution. Consequently, our current search approach is designed to avoid detecting such objects. As this paper focuses on identifying DCBHs in their “pure” (or nearly pure) state, the upper limits on the comoving density of DCBH host halos that we present can admittedly be circumvented in scenarios where star formation is quickly triggered in the host halos of newborn DCBHs, where the DCBH host halo merges with a nearby star-forming halo or in which the DCBH SED otherwise deviates significantly from the Pacucci et al. (2016) prediction.
Acknowledgments
A.N. and E.Z. acknowledge funding from Olle Engkvists Stiftelse. E.Z. also acknowledges grant 2022-03804 from the Swedish Research Council, funding from the Swedish National Space Agency and has benefited from a sabbatical at the Swedish Collegium for Advanced Study. W.P.M. acknowledges that the National Aeronautics and Space Administration provided support for this work through Chandra Award Numbers GO8-19119X, GO9-20123X, GO0-21126X, and GO1-22134X issued by the Chandra X-ray Center, which the Smithsonian Astrophysical Observatory operates for and on behalf of the National Aeronautics Space Administration under contract NAS8-03060. F.P. acknowledges support from a Clay Fellowship administered by the Smithsonian Astrophysical Observatory. This work was also supported by the Black Hole Initiative at Harvard University, which is funded by grants from the John Templeton Foundation and the Gordon and Betty Moore Foundation. This work is also based on observations made with the NASA/ESA/CSA James Webb Space Telescope. The data were obtained from the Mikulski Archive for Space Telescopes at the Space Telescope Science Institute, which is operated by the Association of Universities for Research in Astronomy, Inc., under NASA contract NAS 5-03127 for JWST. These observations are associated with JWST programs 1176 and 2738. R.A.W., S.H.C., and R.A.J. acknowledge support from NASA JWST Interdisciplinary Scientist grants NAG5-12460, NNX14AN10G, and 80NSSC18K0200 from GSFC. Work by C.J.C. and N.J.A. acknowledge support from the European Research Council (ERC) Advanced Investigator Grant EPOCHS (788113). B.L.F. thanks the Berkeley Center for Theoretical Physics for their hospitality during the writing of this paper. M.A.M. acknowledges the support of a National Research Council of Canada Plaskett Fellowship, and the Australian Research Council Centre of Excellence for All Sky Astrophysics in 3 Dimensions (ASTRO 3D), through project number CE17010001. C.N.A.W. acknowledges funding from the JWST/NIRCam contract NASS-0215 to the University of Arizona. A.Z. acknowledges support by Grant No. 2020750 from the United States-Israel Binational Science Foundation (BSF) and Grant No. 2109066 from the United States National Science Foundation (NSF), and by the Ministry of Science & Technology, Israel. We also acknowledge the indigenous peoples of Arizona, including the Akimel O’odham (Pima) and Pee Posh (Maricopa) Indian Communities, whose care and keeping of the land has enabled us to be at ASU’s Tempe campus in the Salt River Valley, where much of our work was conducted.
References
- Algera, H. S. B., Inami, H., Oesch, P. A., et al. 2023, MNRAS, 518, 6142 [Google Scholar]
- Aykutalp, A., Wise, J. H., Spaans, M., & Meijerink, R. 2014, ApJ, 797, 139 [NASA ADS] [CrossRef] [Google Scholar]
- Aykutalp, A., Barrow, K. S. S., Wise, J. H., & Johnson, J. L. 2020, ApJ, 898, L53 [NASA ADS] [CrossRef] [Google Scholar]
- Bañados, E., Venemans, B. P., Mazzucchelli, C., et al. 2018, Nature, 553, 473 [Google Scholar]
- Baraffe, I., Homeier, D., Allard, F., & Chabrier, G. 2015, A&A, 577, A42 [NASA ADS] [CrossRef] [EDP Sciences] [Google Scholar]
- Barro, G., Perez-Gonzalez, P. G., Kocevski, D. D., et al. 2023, ApJ, submitted [arXiv:2305.14418] [Google Scholar]
- Barrow, K. S. S., Aykutalp, A., & Wise, J. H. 2018, Nat. Astron., 2, 987 [NASA ADS] [CrossRef] [Google Scholar]
- Barrufet, L., Oesch, P. A., Weibel, A., et al. 2023, MNRAS, 522, 449 [NASA ADS] [CrossRef] [Google Scholar]
- Begelman, M. C. 1978, MNRAS, 184, 53 [NASA ADS] [CrossRef] [Google Scholar]
- Begelman, M. C., & Volonteri, M. 2017, MNRAS, 464, 1102 [NASA ADS] [CrossRef] [Google Scholar]
- Bertin, E., & Arnouts, S. 1996, A&AS, 117, 393 [NASA ADS] [CrossRef] [EDP Sciences] [Google Scholar]
- Boekholt, T. C. N., Schleicher, D. R. G., Fellhauer, M., et al. 2018, MNRAS, 476, 366 [Google Scholar]
- Bromm, V., & Loeb, A. 2003, ApJ, 596, 34 [Google Scholar]
- Carnall, A. C., McLure, R. J., Dunlop, J. S., & Davé, R. 2018, MNRAS, 480, 4379 [Google Scholar]
- Davies, M. B., Miller, M. C., & Bellovary, J. M. 2011, ApJ, 740, L42 [NASA ADS] [CrossRef] [Google Scholar]
- Eisenstein, D. J., Willott, C., Alberts, S., et al. 2023, ApJS, submitted [arXiv:2306.02465] [Google Scholar]
- Fan, X., Narayanan, V. K., Lupton, R. H., et al. 2001, AJ, 122, 2833 [Google Scholar]
- Fan, X., Strauss, M. A., Schneider, D. P., et al. 2003, AJ, 125, 1649 [Google Scholar]
- Fan, X., Bañados, E., & Simcoe, R. A. 2023, ARA&A, 61, 373 [NASA ADS] [CrossRef] [Google Scholar]
- Ferrara, A., Salvadori, S., Yue, B., & Schleicher, D. 2014, MNRAS, 443, 2410 [NASA ADS] [CrossRef] [Google Scholar]
- Finkelstein, S. L., Bagley, M. B., Haro, P. A., et al. 2022, ApJ, 940, L55 [NASA ADS] [CrossRef] [Google Scholar]
- Furtak, L. J., Zitrin, A., Plat, A., et al. 2023, ApJ, 952, 142 [NASA ADS] [CrossRef] [Google Scholar]
- Greene, J. E., Labbe, I., Goulding, A. D., et al. 2023, ApJ, submitted [arXiv:2309.05714] [Google Scholar]
- Habouzit, M., Volonteri, M., Latif, M., Dubois, Y., & Peirani, S. 2016, MNRAS, 463, 529 [NASA ADS] [CrossRef] [Google Scholar]
- Hasinger, G. 2020, JCAP, 2020, 022 [CrossRef] [Google Scholar]
- Inayoshi, K., Visbal, E., & Haiman, Z. 2020, ARA&A, 58, 27 [NASA ADS] [CrossRef] [Google Scholar]
- Inayoshi, K., Onoue, M., Sugahara, Y., Inoue, A. K., & Ho, L. C. 2022, ApJ, 931, L25 [NASA ADS] [CrossRef] [Google Scholar]
- Jansen, R. A., & Windhorst, R. A. 2018, PASP, 130, 124001 [CrossRef] [Google Scholar]
- Johnson, J. L., & Aykutalp, A. 2019, ApJ, 879, 18 [NASA ADS] [CrossRef] [Google Scholar]
- Katz, H., Sijacki, D., & Haehnelt, M. G. 2015, MNRAS, 451, 2352 [Google Scholar]
- Kocevski, D. D., Onoue, M., Inayoshi, K., et al. 2023, ApJ, 954, L4 [NASA ADS] [CrossRef] [Google Scholar]
- Kokorev, V., Jin, S., Magdis, G. E., et al. 2023, ApJ, 945, L25 [NASA ADS] [CrossRef] [Google Scholar]
- Labbe, I., Greene, J. E., Bezanson, R., et al. 2023, ApJ, submitted [arXiv:2306.07320] [Google Scholar]
- Larson, R. L., Finkelstein, S. L., Kocevski, D. D., et al. 2023, ApJ, 953, L29 [NASA ADS] [CrossRef] [Google Scholar]
- Latif, M. A., Schleicher, D. R. G., Schmidt, W., & Niemeyer, J. 2013, MNRAS, 433, 1607 [NASA ADS] [CrossRef] [Google Scholar]
- Latif, M. A., Whalen, D. J., Khochfar, S., Herrington, N. P., & Woods, T. E. 2022, Nature, 607, 48 [CrossRef] [Google Scholar]
- Lodato, G., & Natarajan, P. 2006, MNRAS, 371, 1813 [NASA ADS] [CrossRef] [Google Scholar]
- Loeb, A., & Rasio, F. A. 1994, ApJ, 432, 52 [Google Scholar]
- Maiolino, R., Scholtz, J., Witstok, J., et al. 2024, Nature, in press https://doi.org/10.1038/s41586-024-07052-5 [Google Scholar]
- Matthee, J., Naidu, R. P., Brammer, G., et al. 2023, ApJ, submitted [arXiv:2306.05448] [Google Scholar]
- Mortlock, D. J., Warren, S. J., Venemans, B. P., et al. 2011, Nature, 474, 616 [Google Scholar]
- Nakajima, K., & Maiolino, R. 2022, MNRAS, 513, 5134 [NASA ADS] [CrossRef] [Google Scholar]
- Natarajan, P., Pacucci, F., Ferrara, A., et al. 2017, ApJ, 838, 117 [NASA ADS] [CrossRef] [Google Scholar]
- Pacucci, F., & Loeb, A. 2020, ApJ, 895, 95 [NASA ADS] [CrossRef] [Google Scholar]
- Pacucci, F., & Loeb, A. 2022, MNRAS, 509, 1885 [Google Scholar]
- Pacucci, F., Ferrara, A., Volonteri, M., & Dubus, G. 2015, MNRAS, 454, 3771 [Google Scholar]
- Pacucci, F., Ferrara, A., Grazian, A., et al. 2016, MNRAS, 459, 1432 [NASA ADS] [CrossRef] [Google Scholar]
- Pacucci, F., Natarajan, P., Volonteri, M., Cappelluti, N., & Urry, C. M. 2017a, ApJ, 850, L42 [NASA ADS] [CrossRef] [Google Scholar]
- Pacucci, F., Pallottini, A., Ferrara, A., & Gallerani, S. 2017b, MNRAS, 468, L77 [Google Scholar]
- Pacucci, F., Baldassare, V., Cappelluti, N., et al. 2019, BAAS, 51, 117 [NASA ADS] [Google Scholar]
- Phillips, M. W., Tremblin, P., Baraffe, I., et al. 2020, A&A, 637, A38 [NASA ADS] [CrossRef] [EDP Sciences] [Google Scholar]
- Polletta, M., Tajer, M., Maraschi, L., et al. 2007, ApJ, 663, 81 [NASA ADS] [CrossRef] [Google Scholar]
- Portegies Zwart, S. F., & McMillan, S. L. W. 2002, ApJ, 576, 899 [Google Scholar]
- Rieke, M. J., Kelly, D. M., Misselt, K., et al. 2023, PASP, 135, 028001 [CrossRef] [Google Scholar]
- Rodighiero, G., Bisigello, L., Iani, E., et al. 2023, MNRAS, 518, L19 [Google Scholar]
- Smail, I., Dudzevičiūtė, U., Gurwell, M., et al. 2023, ApJ, 958, 36 [NASA ADS] [CrossRef] [Google Scholar]
- Valiante, R., Agarwal, B., Habouzit, M., & Pezzulli, E. 2017, PASA, 34, e031 [Google Scholar]
- Valiante, R., Schneider, R., Zappacosta, L., et al. 2018, MNRAS, 476, 407 [NASA ADS] [CrossRef] [Google Scholar]
- Visbal, E., & Haiman, Z. 2018, ApJ, 865, L9 [NASA ADS] [CrossRef] [Google Scholar]
- Volonteri, M., Habouzit, M., & Colpi, M. 2021, Nat. Rev. Phys., 3, 732 [NASA ADS] [CrossRef] [Google Scholar]
- Wang, L., Baade, D., Baron, E., et al. 2017, arXiv e-prints [arXiv:1710.07005] [Google Scholar]
- Wang, F., Yang, J., Fan, X., et al. 2021, ApJ, 907, L1 [Google Scholar]
- Whalen, D. J., Surace, M., Bernhardt, C., et al. 2020, ApJ, 897, L16 [NASA ADS] [CrossRef] [Google Scholar]
- Windhorst, R. A., Cohen, S. H., Jansen, R. A., et al. 2023, AJ, 165, 13 [NASA ADS] [CrossRef] [Google Scholar]
- Woods, T. E., Agarwal, B., Bromm, V., et al. 2019, PASA, 36, e027 [Google Scholar]
- Wu, X.-B., Wang, F., Fan, X., et al. 2015, Nature, 518, 512 [Google Scholar]
- Wyithe, J. S. B., & Loeb, A. 2012, MNRAS, 425, 2892 [NASA ADS] [CrossRef] [Google Scholar]
- Yang, J., Wang, F., Fan, X., et al. 2020, ApJ, 897, L14 [Google Scholar]
- Zackrisson, E., Rydberg, C.-E., Schaerer, D., Östlin, G., & Tuli, M. 2011a, ApJ, 740, 13 [NASA ADS] [CrossRef] [Google Scholar]
- Zackrisson, E., Inoue, A. K., Rydberg, C.-E., & Duval, F. 2011b, MNRAS, 418, L104 [NASA ADS] [CrossRef] [Google Scholar]
- Zhao, X., Civano, F., Fornasini, F. M., et al. 2021, MNRAS, 508, 5176 [NASA ADS] [CrossRef] [Google Scholar]
Appendix A: Properties of galaxies with the potential to mimic the spectral energy distributions of direct-collapse black holes
In this appendix, we provide additional constraints on the properties of galaxies capable of mimicking the photometric signatures of DCBHs. Treating the Pacucci et al. (2016) DCBH SED models as mock observations and attaching realistic observational errorbars to the resulting NIRCam photometric data points, we used the BAGPIPES code (Carnall et al. 2018) to fit galaxy models to these data. We found that the mock NIRCam photometry can be reproduced by galaxies with a dust attenuation of AV ≳ 2 mag over a wide range of redshifts.
Figure A.1 presents two cases where mock NIRCam data generated from DCBH models at zDCBH = 6 (a) and zDCBH = 12 (b) DCBH are fitted by models involving highly dust-reddened stellar populations. The first case involves a dusty stellar population at a redshift similar to that of the DCBH model, while the second case involves a dusty galaxy at a significantly lower redshift of z ≈ 4. It is also possible to find solutions in which the best-fitting galaxy models have redshifts higher than those of the underlying DCBH models. However, since this requires extremely dusty galaxies that form very early in the history of the Universe, such interlopers should be considerably less common (Algera et al. 2023). Moreover, medium-band filters are also effective at removing dusty galaxies.
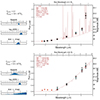 |
Fig. A.1. BAGPIPES fits of galaxy models to mock DCBH data. The red squares represent the best-fitting galaxy model, based on the red model galaxy spectrum, to the photometric fluxes of MDCBH = 5 × 10⁵ M⊙ DCBH model (black circles with mock error bars) from Pacucci et al. (2016). Red triangles indicate filters where the mock DCBH fluxes fall below the PEARLS detection limits of the NEP field. The estimated errors on the fitted redshift, total stellar mass, and dust attenuation of the galactic fit are indicated by the sliders to the left of each plot. Top: Example where a zDCBH = 6 spectrum is fitted by a dusty galaxy model at a similar redshift (z ≈ 5.62). Bottom: Example where a zDCBH = 12 spectrum is fitted by a dusty galaxy model at a significantly lower redshift (z ≈ 3.94). |
All Tables
Selected sources and corresponding best-fit parameters obtained with the z > 6 DCBH models (Pacucci et al. 2016).
All Figures
|
Fig. 1. DCBH detection limits in the NEP. The thick dashed line represents the combined JWST/NIRCam 5σ flux detection limits expressed in AB magnitudes across the NEP spokes. The colored lines show the photometric fluxes of the Pacucci et al. (2016) 5 × 10⁶ M⊙ DCBH model at z = 6, 10, 15, and 20 in the set of NIRCam filters used by PEARLS across the NEP field. The thin solid black line shows the z = 6 version of the DCBH model spectrum on which the photometric predictions are based, but offset by 0.5 mag for clarity. As can be seen, this Pacucci et al. (2016) 5 × 10⁶ M⊙ DCBH model remains detectable up to z = 20 in the reddest NIRCam filters used. The photometric SEDs are characterized by a significantly red slope across the NIRCam bands and are relatively featureless except for the drop at the Lyα limit and the bump seen in the F444W filter at z = 6 SED, which is due to strong Hα emission. This is not seen in the higher-redshift SEDs, since it redshifts out of the NIRcam range at z ≳ 6.9. |
| In the text | |
|
Fig. 2. Mass-redshift degeneracy for DCHB SEDs without a clear-cut Lyα break. If the Lyα break is close to or below the detection threshold (dashed black line), acceptable SED fits to NIRCam data at longer wavelengths can be achieved for DCBH models over a wide range of redshifts. Here, the purple line corresponds to the photometric SED of a z = 12.7 DCBH with mass log10(MDCBH/M⊙) = 5.70, and the thin solid line is the corresponding spectrum (offset by 0.1 mag for clarity). In this case, the Lyα break occurs at ≈1.7 μm between the F150W and F200W filters. While the F200W flux is largely unaffected by the Lyα break, the red slope of the DCBH SED still places the F200W flux below the detection limit of the NEP field. Since a sharp drop in flux at the Lyα limit becomes unobservable in this case, the redshift becomes poorly constrained as higher-mass DCBH models at z = 14 (blue line), z = 16 (green line), and z = 17 (orange line) produce very similar fluxes in the longer-wavelength NIRCam filters (F277W, F356W, F410M, and F444W). |
| In the text | |
|
Fig. 3. Photometric degeneracy between high-z DCBHs, obscured AGN, and very dusty galaxies. The thin black lines represent the Pacucci et al. (2016) model spectra of DCBHs with mass 5 × 10⁶ M⊙ (upper line) and 5 × 10⁵ M⊙ (lower line) at z = 10. The white squares indicate the corresponding integrated fluxes in the NIRCam filters used in the PEARLS/NEP survey. While the detailed spectra of the DCBHs display features that would set them apart from both dusty galaxies and obscured AGN, their photometric properties can be relatively well reproduced by both of these types of objects. The blue line represents the model spectrum of a passively evolving, very dusty (AV ≈ 2.5 mag, Z = 0.004, age ≈2 Gyr) galaxy at z = 2.3 based on the Zackrisson et al. (2011a) set, with filter fluxes (blue squares) that can roughly reproduce the photometric data points of the 5 × 10⁶ M⊙ DCBHs that lie above the PEARLS/NEP detection threshold (dashed black line). The red line and red triangles represent the Polletta et al. (2007) template spectrum and its corresponding NIRCam filter fluxes for an obscured AGN (QSO2 template), redshifted to z = 5 and scaled to match the 5 × 10⁵ M⊙ DCBH model as closely as possible. Also in this case, there is a substantial similarity in the photometric SED between the z = 5 AGN and the z = 10 DCBH. |
| In the text | |
|
Fig. 4. DCBH candidates in PEARLS/NEP. In the left column, we show the JWST/NIRCam photometric fluxes in eight bands (blue dots) and the corresponding best-fitted photometric DCBH models (red dots and solid line) from Pacucci et al. (2016). The dashed lines correspond to NIRCam detection limits. In the right columns, we show the corresponding 2 × 2 arcsec images for the objects DCBH-1 (top) and DCBH-2 (bottom). Tabulated fluxes and coordinates of these objects are listed in Table 1. |
| In the text | |
|
Fig. 5. Detection limits on the number density of halos that may host DCBHs as a function of redshift. The light-gray region represents the approximate range of theoretical predictions of the comoving number densities of halos that may host DCBHs, based on the compilation by Habouzit et al. (2016). The red lines represent the lowest detectable host halo comoving density in the case of a DCBH that remains sufficiently bright for detection in at least four JWST/NIRCam filters and retains its characteristic spectral signatures for 10 Myr given the total survey areas of PEARLS NEP (four spokes; solid red line), CEERS (dashed red) and JADES (dotted red). The part of the parameter space ruled out by the current limit derived in this paper is marked by the dark-gray region. The dashed black line represents the approximate z = 6 quasar number density DCBH models must exceed prior to these redshifts to explain the SMBH powering these objects. |
| In the text | |
|
Fig. A.1. BAGPIPES fits of galaxy models to mock DCBH data. The red squares represent the best-fitting galaxy model, based on the red model galaxy spectrum, to the photometric fluxes of MDCBH = 5 × 10⁵ M⊙ DCBH model (black circles with mock error bars) from Pacucci et al. (2016). Red triangles indicate filters where the mock DCBH fluxes fall below the PEARLS detection limits of the NEP field. The estimated errors on the fitted redshift, total stellar mass, and dust attenuation of the galactic fit are indicated by the sliders to the left of each plot. Top: Example where a zDCBH = 6 spectrum is fitted by a dusty galaxy model at a similar redshift (z ≈ 5.62). Bottom: Example where a zDCBH = 12 spectrum is fitted by a dusty galaxy model at a significantly lower redshift (z ≈ 3.94). |
| In the text | |
Current usage metrics show cumulative count of Article Views (full-text article views including HTML views, PDF and ePub downloads, according to the available data) and Abstracts Views on Vision4Press platform.
Data correspond to usage on the plateform after 2015. The current usage metrics is available 48-96 hours after online publication and is updated daily on week days.
Initial download of the metrics may take a while.