Fig. 5
Download original image
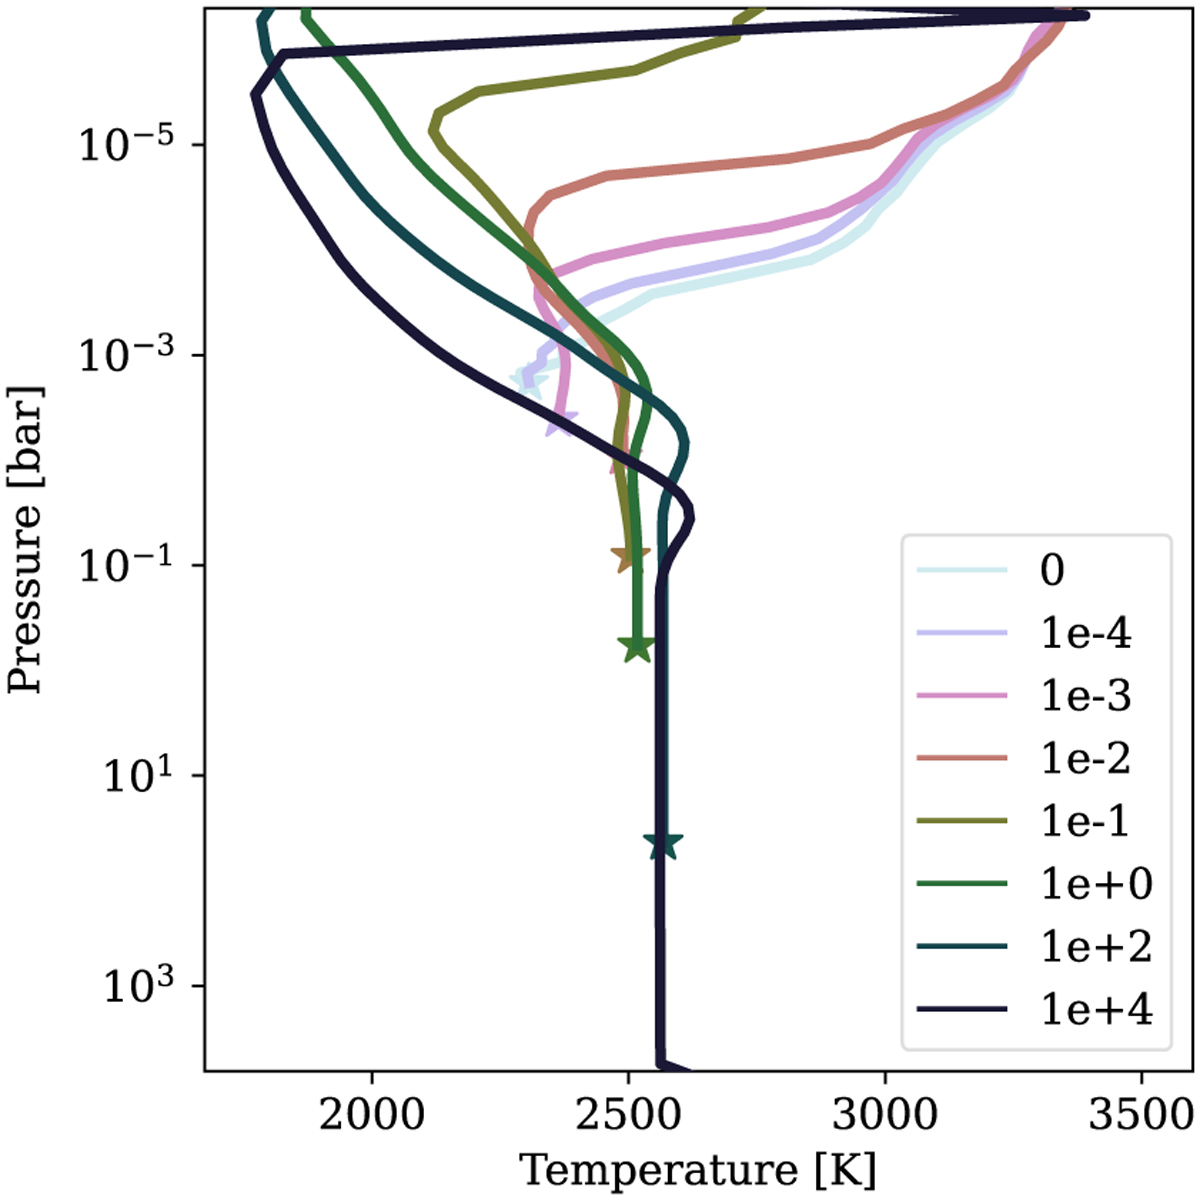
Thermal structure of the atmosphere of a rocky planet at Teq = 2400 K calculated by ATMO (plain lines), for different hydrogen content ![]() (in bar), indicated by the colors. The stars indicate the surface of each case, that is, the point where the atmosphere reaches the vapor pressure (see Fig. 2), and therefore, the ocean below. The surface temperature and pressure increase for larger
(in bar), indicated by the colors. The stars indicate the surface of each case, that is, the point where the atmosphere reaches the vapor pressure (see Fig. 2), and therefore, the ocean below. The surface temperature and pressure increase for larger ![]() .
.
Current usage metrics show cumulative count of Article Views (full-text article views including HTML views, PDF and ePub downloads, according to the available data) and Abstracts Views on Vision4Press platform.
Data correspond to usage on the plateform after 2015. The current usage metrics is available 48-96 hours after online publication and is updated daily on week days.
Initial download of the metrics may take a while.