Fig. A.3
Download original image
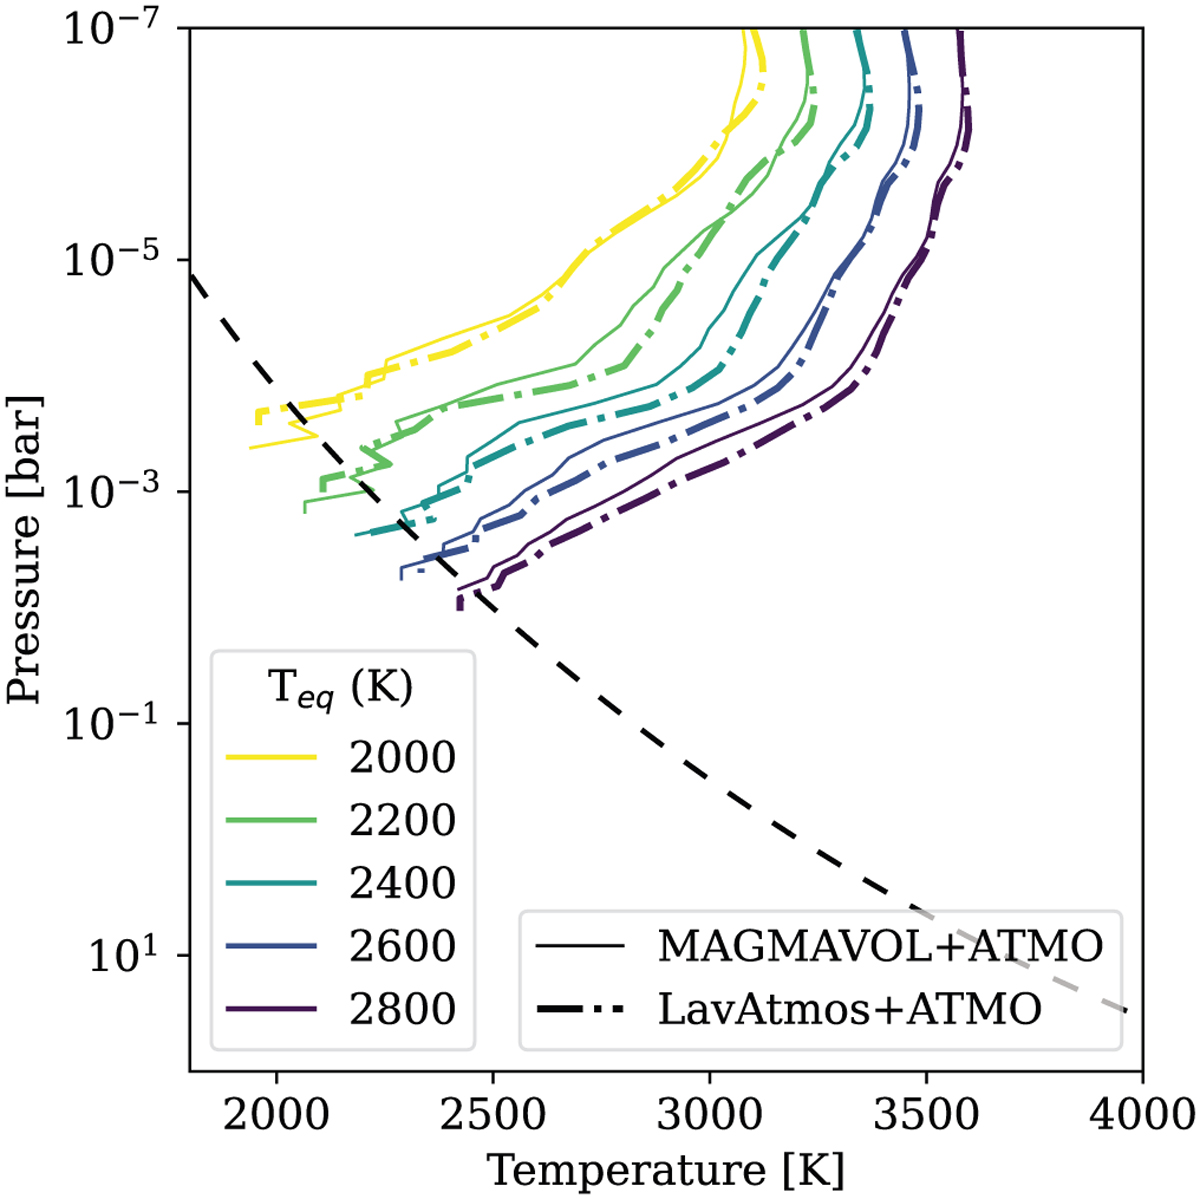
Thermal structure of the silicate atmosphere calculated by ATMO for different equilibrium temperatures Teq (indicated by the colors), which translates as different orbital radii. The dash-dotted PT profiles use the vapor computed via LavAtmos, while the plain lines use MAGMAVOL. The dashed line show the vapor pressure Pvap(T) corresponding to the limit between the magma ocean and the gaseous atmosphere.
Current usage metrics show cumulative count of Article Views (full-text article views including HTML views, PDF and ePub downloads, according to the available data) and Abstracts Views on Vision4Press platform.
Data correspond to usage on the plateform after 2015. The current usage metrics is available 48-96 hours after online publication and is updated daily on week days.
Initial download of the metrics may take a while.