Fig. 6.
Download original image
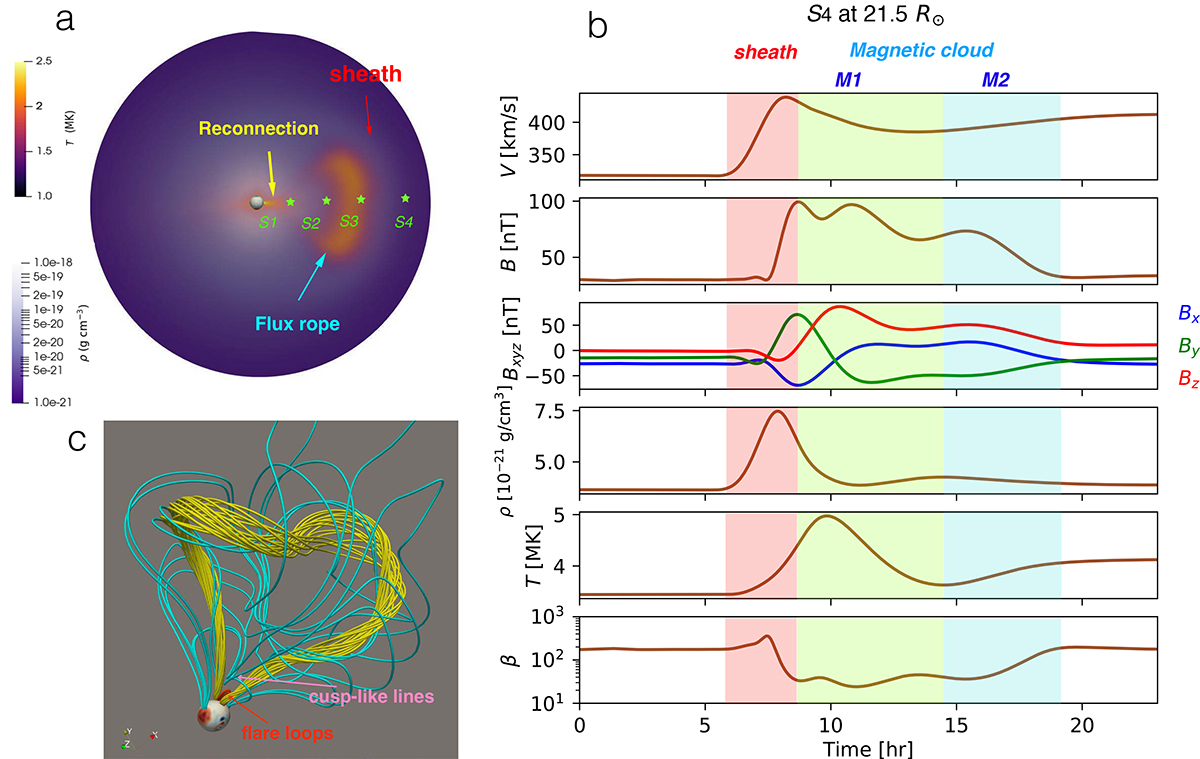
Magnetic field and thermodynamic structure of the CME. Panel a shows the density and temperature in the meridian plane in 2D. Panel b corresponds to the in situ plasma profile measured by a virtual satellite at around 21.5 R⊙, where the red, green, and blue bands represent the sheath and two subparts of the magnetic cloud (M1 and M2), respectively. Panel c illustrates some typical field lines around the CME, where the yellow, cyan, and red tubes represent the field lines from the original inserting flux rope, newly formed twisted field lines during the CME propagation, and the underlying flare loops, respectively.
Current usage metrics show cumulative count of Article Views (full-text article views including HTML views, PDF and ePub downloads, according to the available data) and Abstracts Views on Vision4Press platform.
Data correspond to usage on the plateform after 2015. The current usage metrics is available 48-96 hours after online publication and is updated daily on week days.
Initial download of the metrics may take a while.