Fig. 2.
Download original image
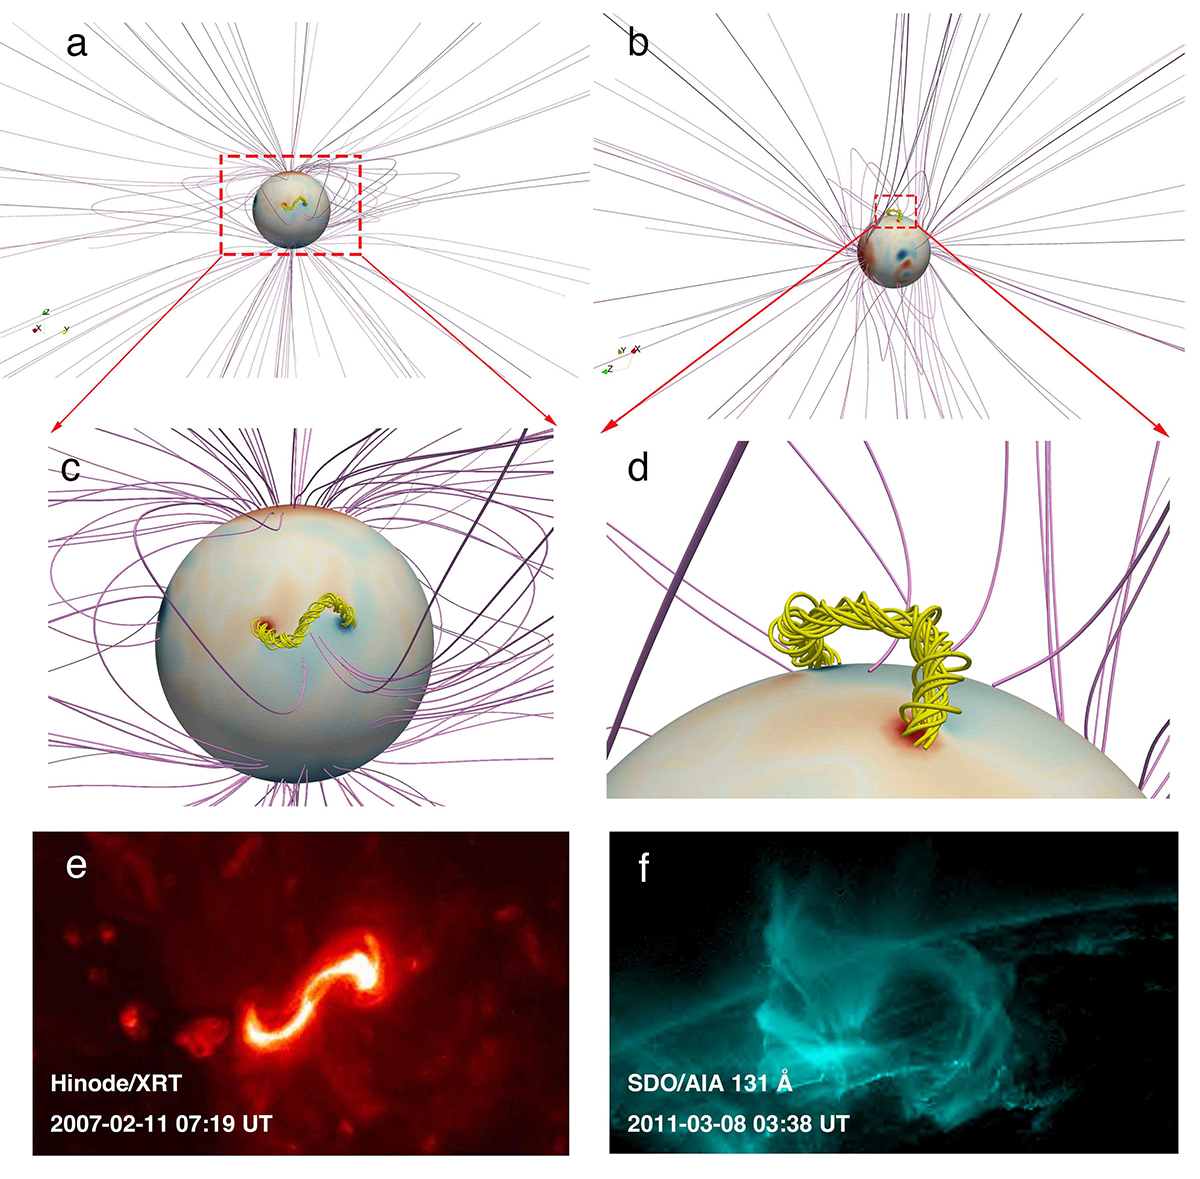
Visualization of the magnetic field lines of the global corona coupled with the RBSL flux rope (yellow tubes) with the background solar wind (pink tubes). Panels a and b illustrate the results viewed from the top and side, respectively. Panels c and d show the zoomed-in views of the red rectangles in panels a and b, respectively. Panels e and f show a typical flux rope in observations that is reflected by the sigmoid viewed on the solar disk and the hot channel at the solar limb. The sigmoid on the solar disk in panel e was observed by the Hinode/XRT. The hot channel above the solar limb in panel f was observed in the SDO/AIA 131 Å band.
Current usage metrics show cumulative count of Article Views (full-text article views including HTML views, PDF and ePub downloads, according to the available data) and Abstracts Views on Vision4Press platform.
Data correspond to usage on the plateform after 2015. The current usage metrics is available 48-96 hours after online publication and is updated daily on week days.
Initial download of the metrics may take a while.