Fig. 1.
Download original image
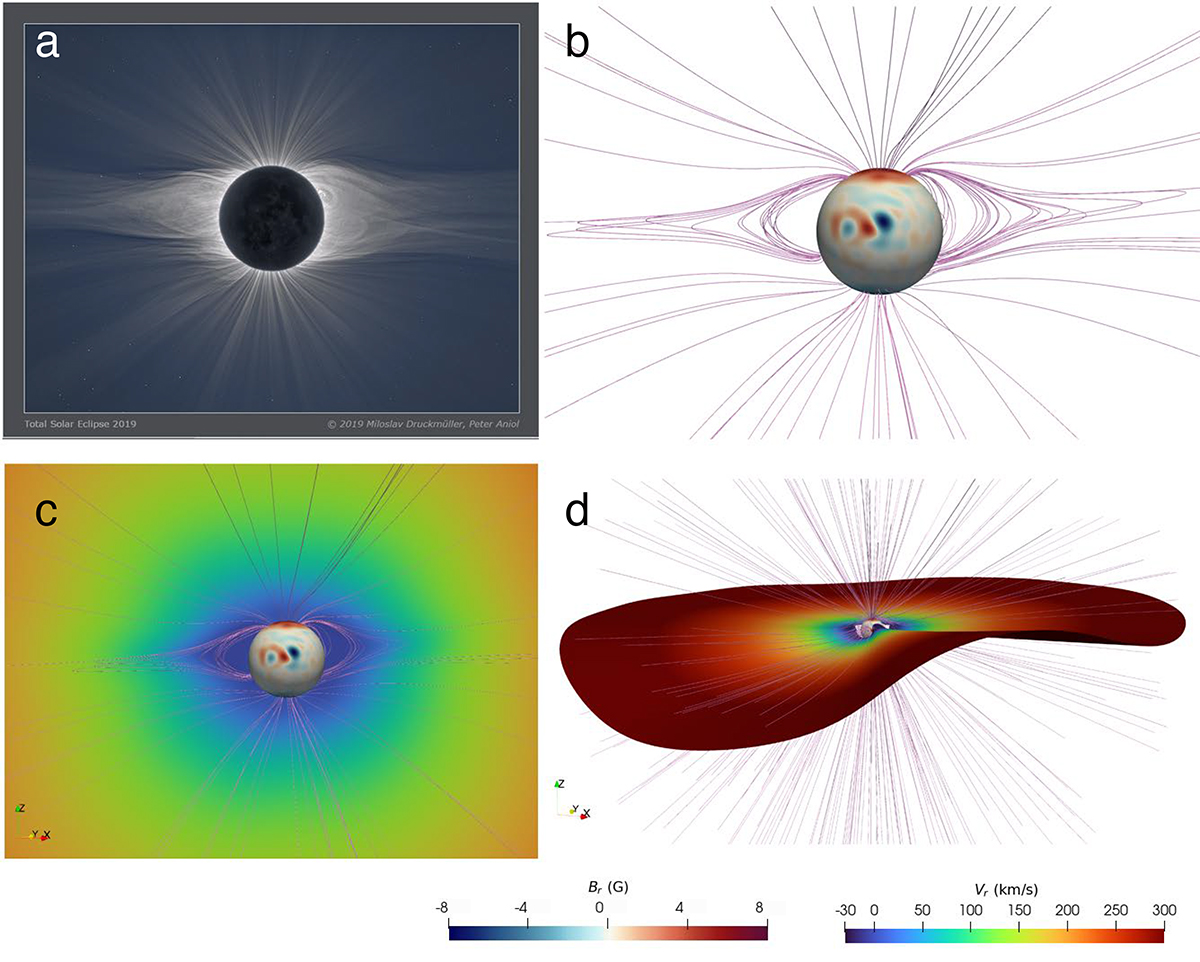
Comparisons between observations and numerical results for the background solar wind. Panel a displays the solar eclipse image of 2 July 2019 (Copyright: 2019 Miloslav Druckmüller, Peter Aniol), corresponding to a minimum of solar activity. Panels b and c correspond to the typical field lines and radial velocity distribution in the meridian plane, respectively. Panel d visualizes the heliospheric current sheet depicted by the isosurface of Br = 0.
Current usage metrics show cumulative count of Article Views (full-text article views including HTML views, PDF and ePub downloads, according to the available data) and Abstracts Views on Vision4Press platform.
Data correspond to usage on the plateform after 2015. The current usage metrics is available 48-96 hours after online publication and is updated daily on week days.
Initial download of the metrics may take a while.