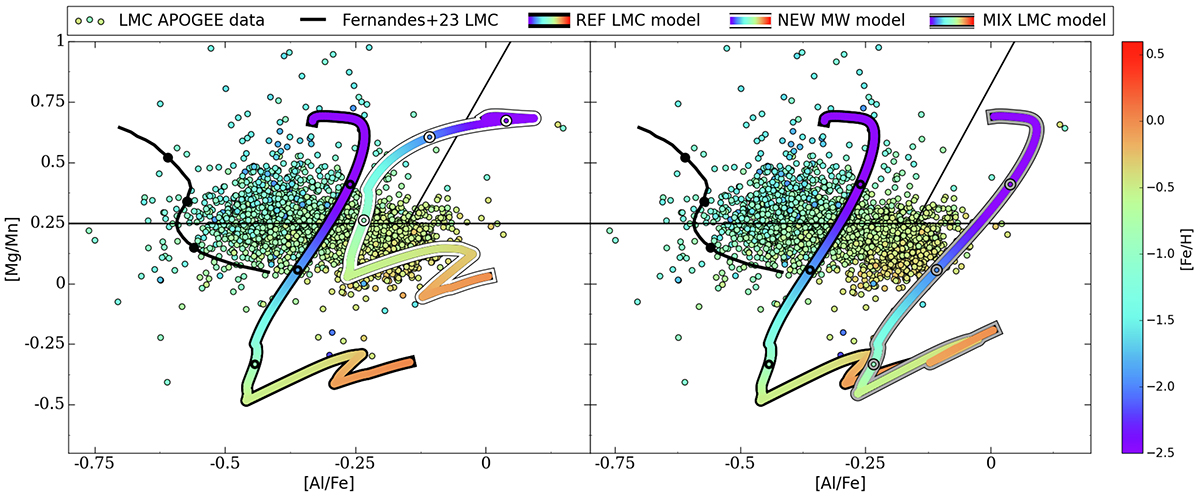
Fig. 5.
Download original image
LMC in [Mg/Mn] versus [Fe/H] plane. In the two panels, we plot our models compared to the APOGEE DR17 data and the model from Fernandes et al. (2023). As in Fig. 3 the colour-coding represents the [Fe/H] content. Again, the circles on the models mark three ages, 0.3 Gyr, 1 Gyr, and 5 Gyr. Here, unlike Fig. 3, the data are not binned. Left panel: REF LMC model (colour-coded black-edge line) and NEW LMC (with yields corrections, colour-coded white-edge line) are compared to data and to results of Fernandes et al. (2023). Right panel: REF LMC model (colour-coded black-edge line) and MIX LMC model (colour-coded grey-edge line) together with data and results of Fernandes et al. (2023).
Current usage metrics show cumulative count of Article Views (full-text article views including HTML views, PDF and ePub downloads, according to the available data) and Abstracts Views on Vision4Press platform.
Data correspond to usage on the plateform after 2015. The current usage metrics is available 48-96 hours after online publication and is updated daily on week days.
Initial download of the metrics may take a while.