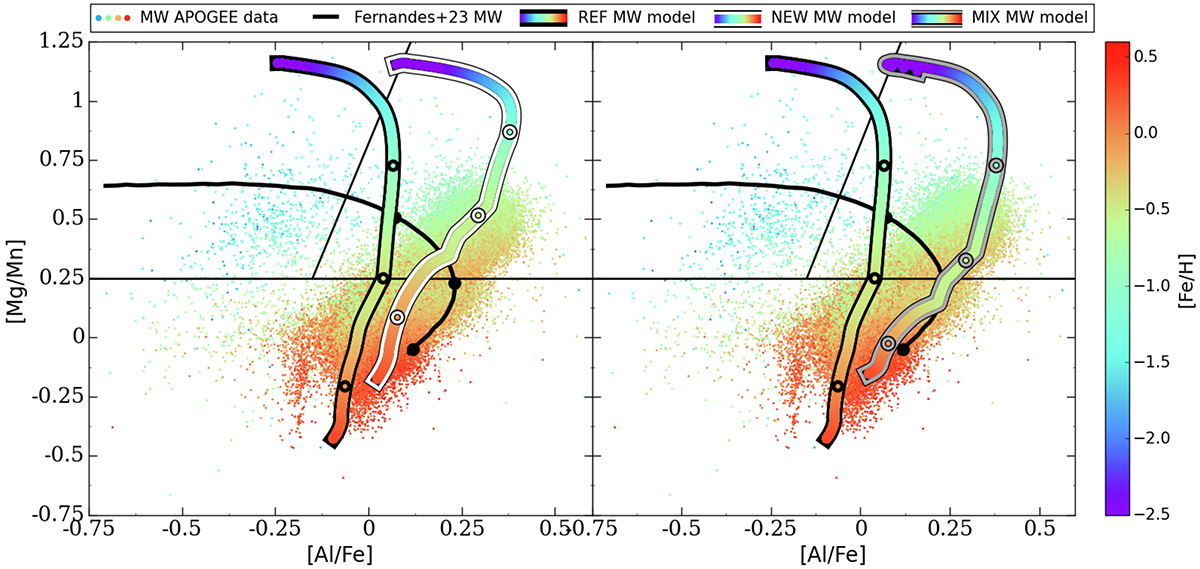
Fig. 3.
Download original image
Data compared to our models and to previous results from the literature. The colour-coding of the models and the data show the [Fe/H] content as explained by the colour bar. In this case, the data are binned so as to show the mean value of [Fe/H] in each bin. The three circles plotted on the models mark the ages 0.3 Gyr, 1 Gyr, and 5 Gyr. The horizontal and diagonal black lines separate three different plane regions as denoted by Fernandes et al. (2023); the unevolved populations lie in the upper left region, the MW high-α in situ population lies in the upper right region; and the MW low-α in situ population lies in the lower region. Left panel: [Mg/Mn] versus [Fe/H] for REF MW model (colour coded black-edge line) and NEW MW model (colour-coded white-edged line) compared to the APOGEE DR17 data of Fernandes et al. (2023) and their best model obtained adopting the prescriptions of Andrews et al. (2017; thin black line). Right panel: [Mg/Mn] versus [Fe/H] for REF MW model (colour-coded black-edge line) and MIX MW model (colour coded grey-edge line) compared to the same data and model by Fernandes et al. (2023).
Current usage metrics show cumulative count of Article Views (full-text article views including HTML views, PDF and ePub downloads, according to the available data) and Abstracts Views on Vision4Press platform.
Data correspond to usage on the plateform after 2015. The current usage metrics is available 48-96 hours after online publication and is updated daily on week days.
Initial download of the metrics may take a while.