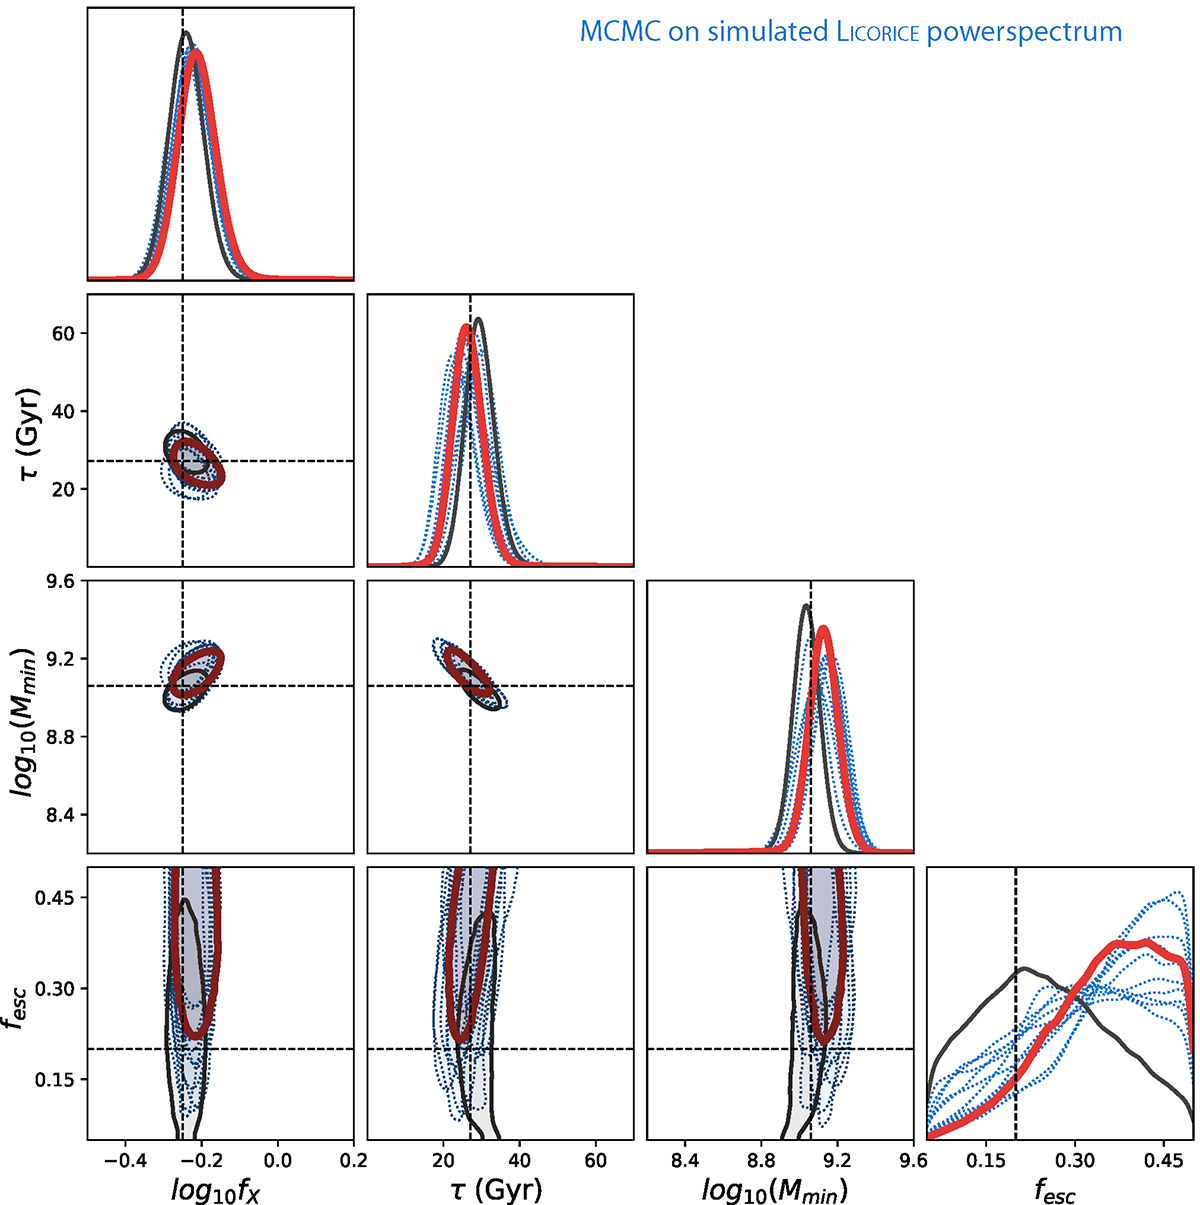
Fig. 14.
Download original image
Results of multiple inferences done using several versions of LOREMU, trained with different weight initializations (dashed). On the 2D panels, only the 1σ contours are shown for clarity. The blue dotted lines are the posteriors obtained using each emulator. The thick red line shows the posterior obtained using the average emulator on the noised signal, while the inference on the noiseless signal is shown in black.
Current usage metrics show cumulative count of Article Views (full-text article views including HTML views, PDF and ePub downloads, according to the available data) and Abstracts Views on Vision4Press platform.
Data correspond to usage on the plateform after 2015. The current usage metrics is available 48-96 hours after online publication and is updated daily on week days.
Initial download of the metrics may take a while.