Fig. 4
Download original image
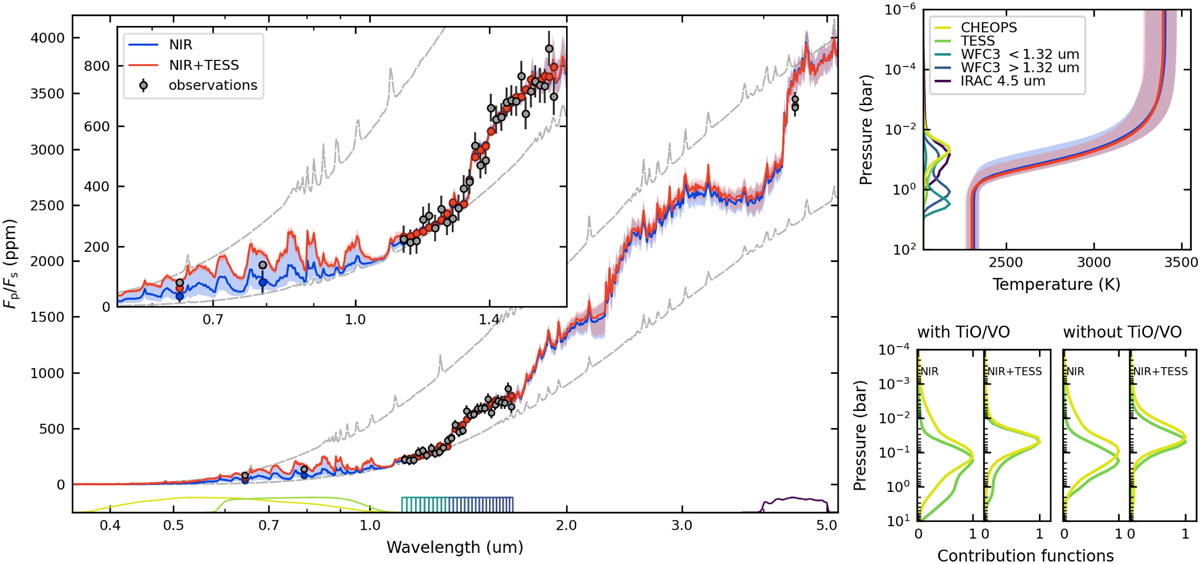
Left: KELT-20 b observed occultation depths (grey markers). The curve at the bottom shows the through-puts for each data point. The solid curves show the median of the retrieved model distributions when fitting the NIR HST and Spitzer occultations (blue) and the NIR+TESS occultations (red). The shaded areas (in corresponding colours) denote the span of the 68% central percentile of the distributions. The dashed grey curves show spectra for two black-body planetary model spectra at 2300 and 3200 K. Top right: retrieved temperature profiles (same colour-coding as before). The curves at the left edge show the contribution functions for selected bands (see legend). Bottom right: contribution functions integrated over the CHEOPS and TESS bands for the two cases shown in the left panel and for retrievals without TiO and VO opacity (same colour-coding as above). The band-integrated thermal flux in CHEOPS and TESS bands are (36 ± 18 ppm) and (85 ± 38 ppm), respectively (coloured markers).
Current usage metrics show cumulative count of Article Views (full-text article views including HTML views, PDF and ePub downloads, according to the available data) and Abstracts Views on Vision4Press platform.
Data correspond to usage on the plateform after 2015. The current usage metrics is available 48-96 hours after online publication and is updated daily on week days.
Initial download of the metrics may take a while.