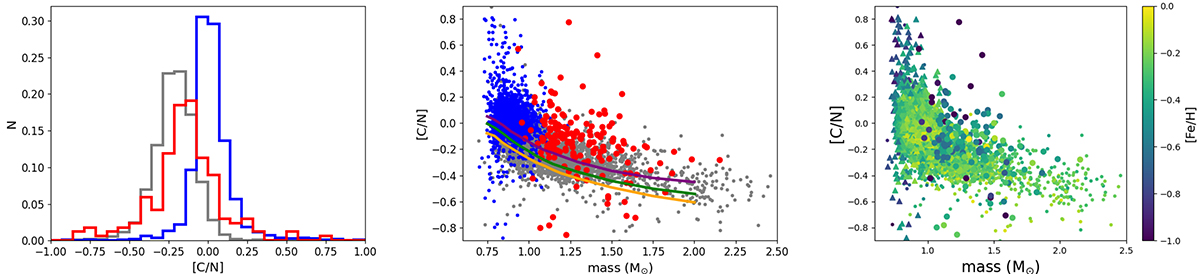
Fig. 6.
Download original image
[C/N] ratio. Left panel: histogram for [C/N] of the stars in our K2 sample (gray, blue, and red histograms represent the low-α, old high-α, and young α-rich samples, respectively). Middle panel: [C/N] vs. mass for the stars in our sample, with colors as in the left panel. The solid lines represent the predictions of stellar evolution models from Vincenzo et al. (2021) at different metallicities ([Fe/H] = −1 in yellow, −0.5 in green, and +0.25 in purple). Right panel: [C/N] ratios for the entire sample color-coded by [Fe/H] (as indicated in the color scale). In this panel are shown low-α (dots), old high-α (triangles), and young-α rich stars (bigger dots).
Current usage metrics show cumulative count of Article Views (full-text article views including HTML views, PDF and ePub downloads, according to the available data) and Abstracts Views on Vision4Press platform.
Data correspond to usage on the plateform after 2015. The current usage metrics is available 48-96 hours after online publication and is updated daily on week days.
Initial download of the metrics may take a while.