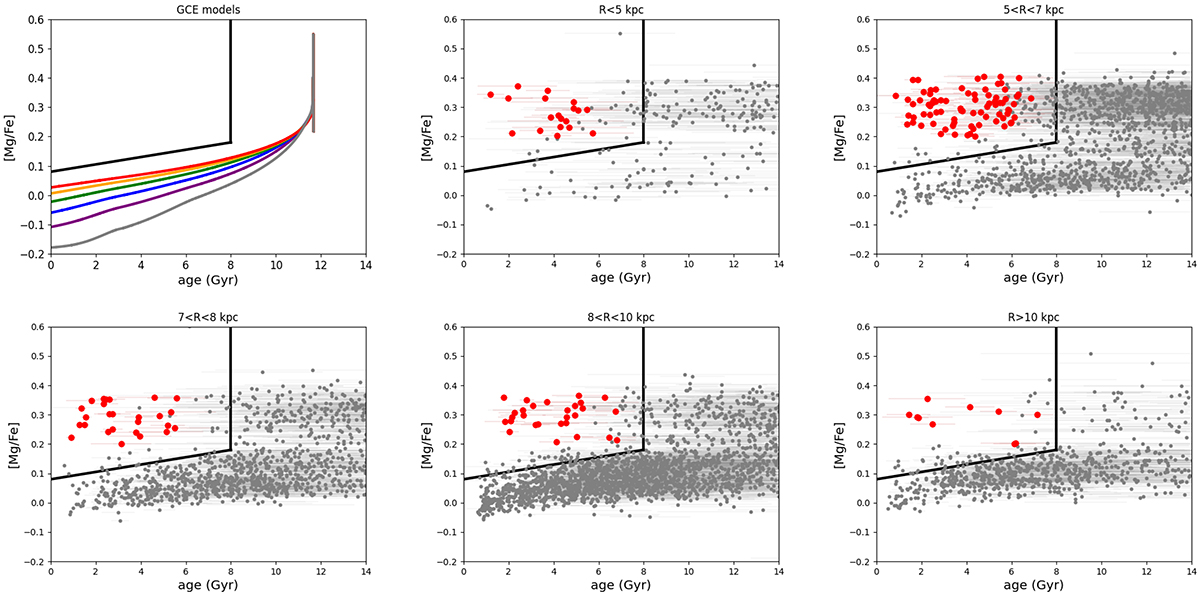
Fig. 2.
Download original image
[Mg/Fe] vs. age diagrams. Upper left panel: predictions of models of the thin disk at different radii: 4 kpc in gray, 6 kpc in purple, 8 kpc in blue, 10 kpc in green, 12 kpc in orange, 14 kpc in red (see Chiappini 2009; Grisoni et al. 2017, 2018). In the other panels the observational data are shown for our sample in different bins of guiding radius. The black lines in the various plots mark the “forbidden region” as defined in Chiappini et al. (2015). The red dots are the young α-rich stars selected in our sample. We report the 1σage error bars.
Current usage metrics show cumulative count of Article Views (full-text article views including HTML views, PDF and ePub downloads, according to the available data) and Abstracts Views on Vision4Press platform.
Data correspond to usage on the plateform after 2015. The current usage metrics is available 48-96 hours after online publication and is updated daily on week days.
Initial download of the metrics may take a while.