Fig. 6
Download original image
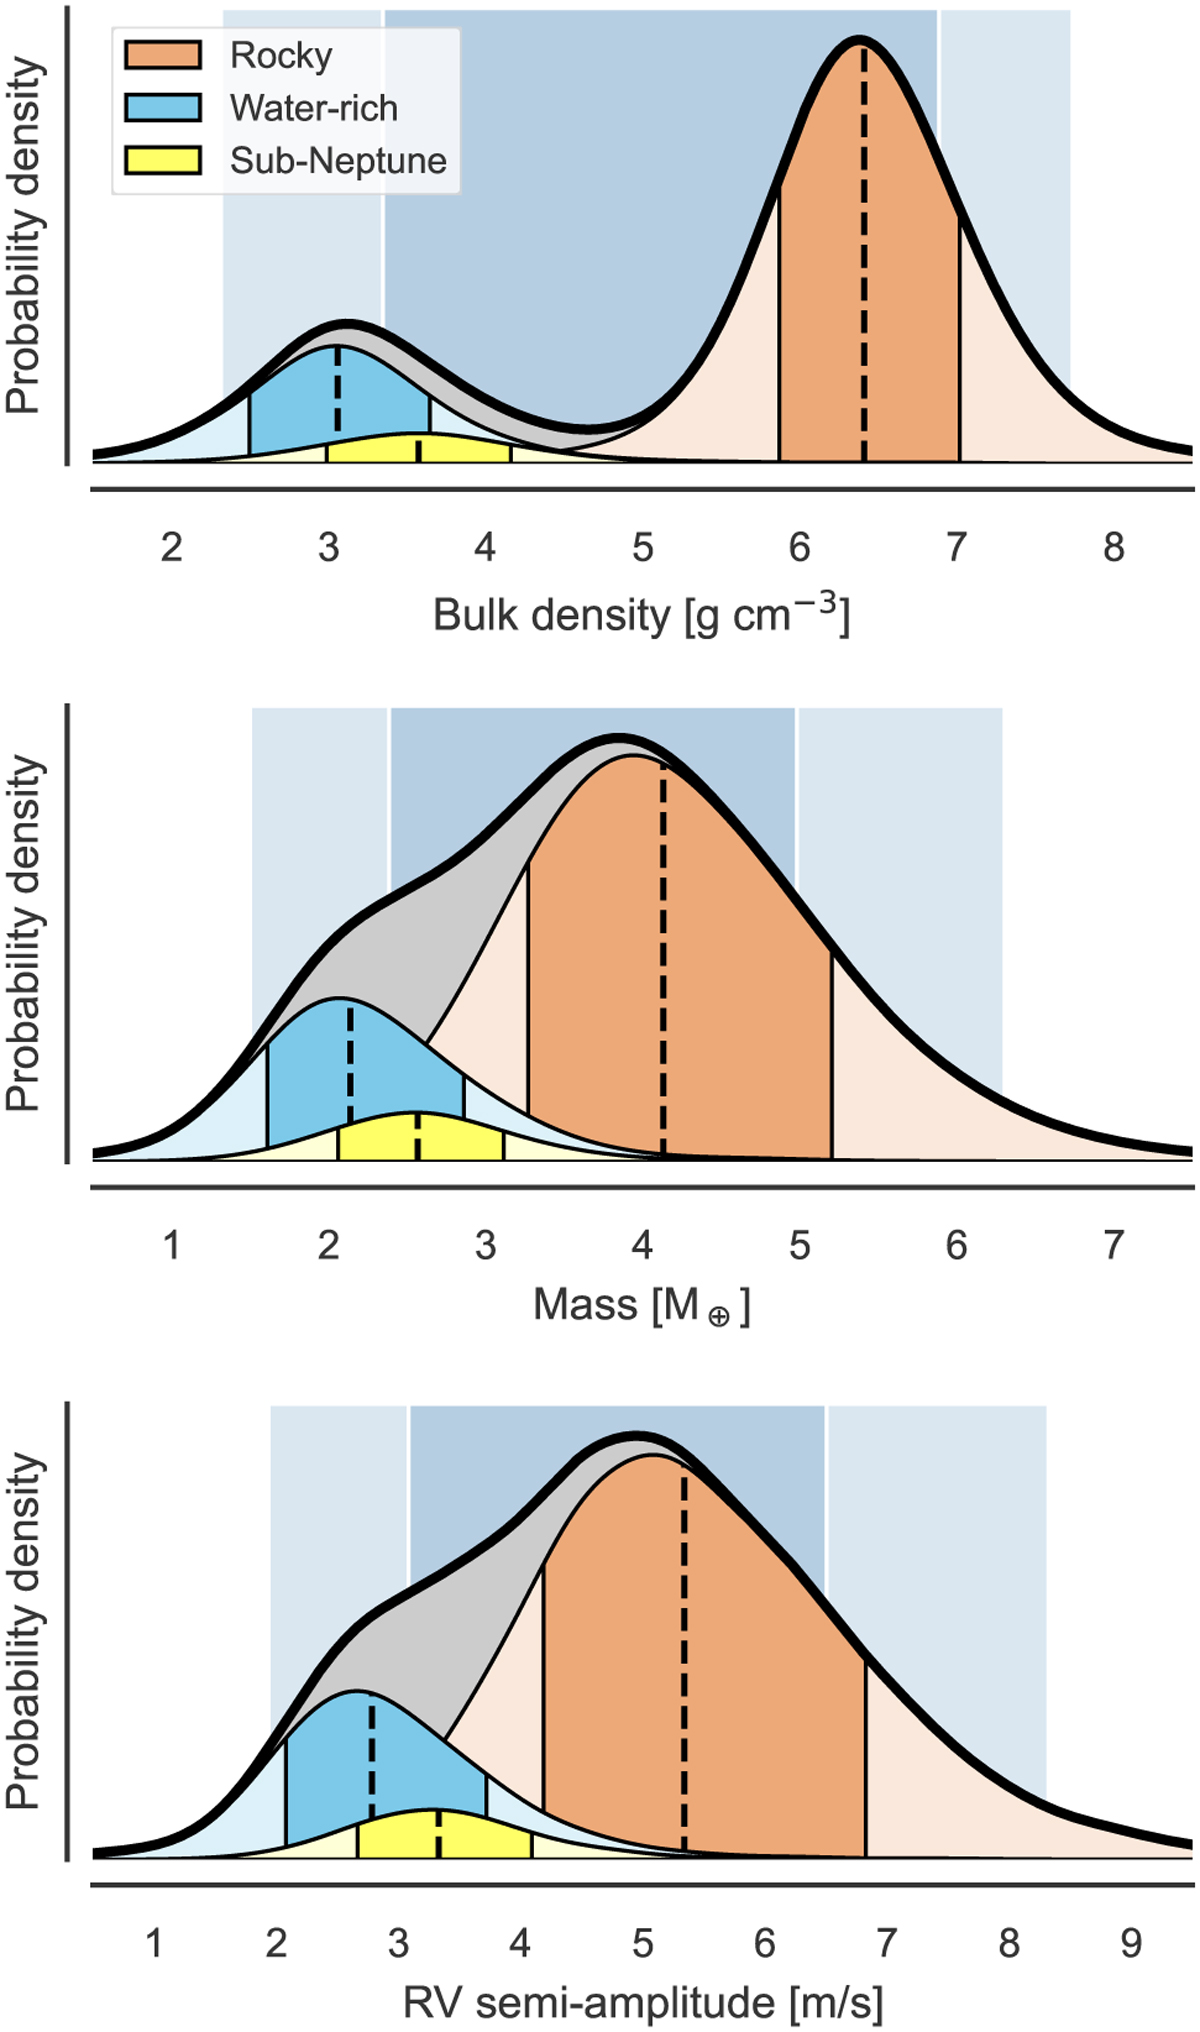
TOI-2266 b's bulk density, mass, and radial velocity semi-amplitude probability distributions given a posterior radius estimate of 1.54 ± 0.09 R⊕ predicted by the SPRIGHT package. The complete probability distribution is marked by a thick black line and gray shading, and the individual contributions from the three SPRIGHT model components (rocky planets, water-rich planets, and sub-Neptunes) are plotted in light brown, light blue, and yellow. The blue shading in the background shows the 68% and 95% central posterior intervals for the distributions.
Current usage metrics show cumulative count of Article Views (full-text article views including HTML views, PDF and ePub downloads, according to the available data) and Abstracts Views on Vision4Press platform.
Data correspond to usage on the plateform after 2015. The current usage metrics is available 48-96 hours after online publication and is updated daily on week days.
Initial download of the metrics may take a while.