Fig. 7
Download original image
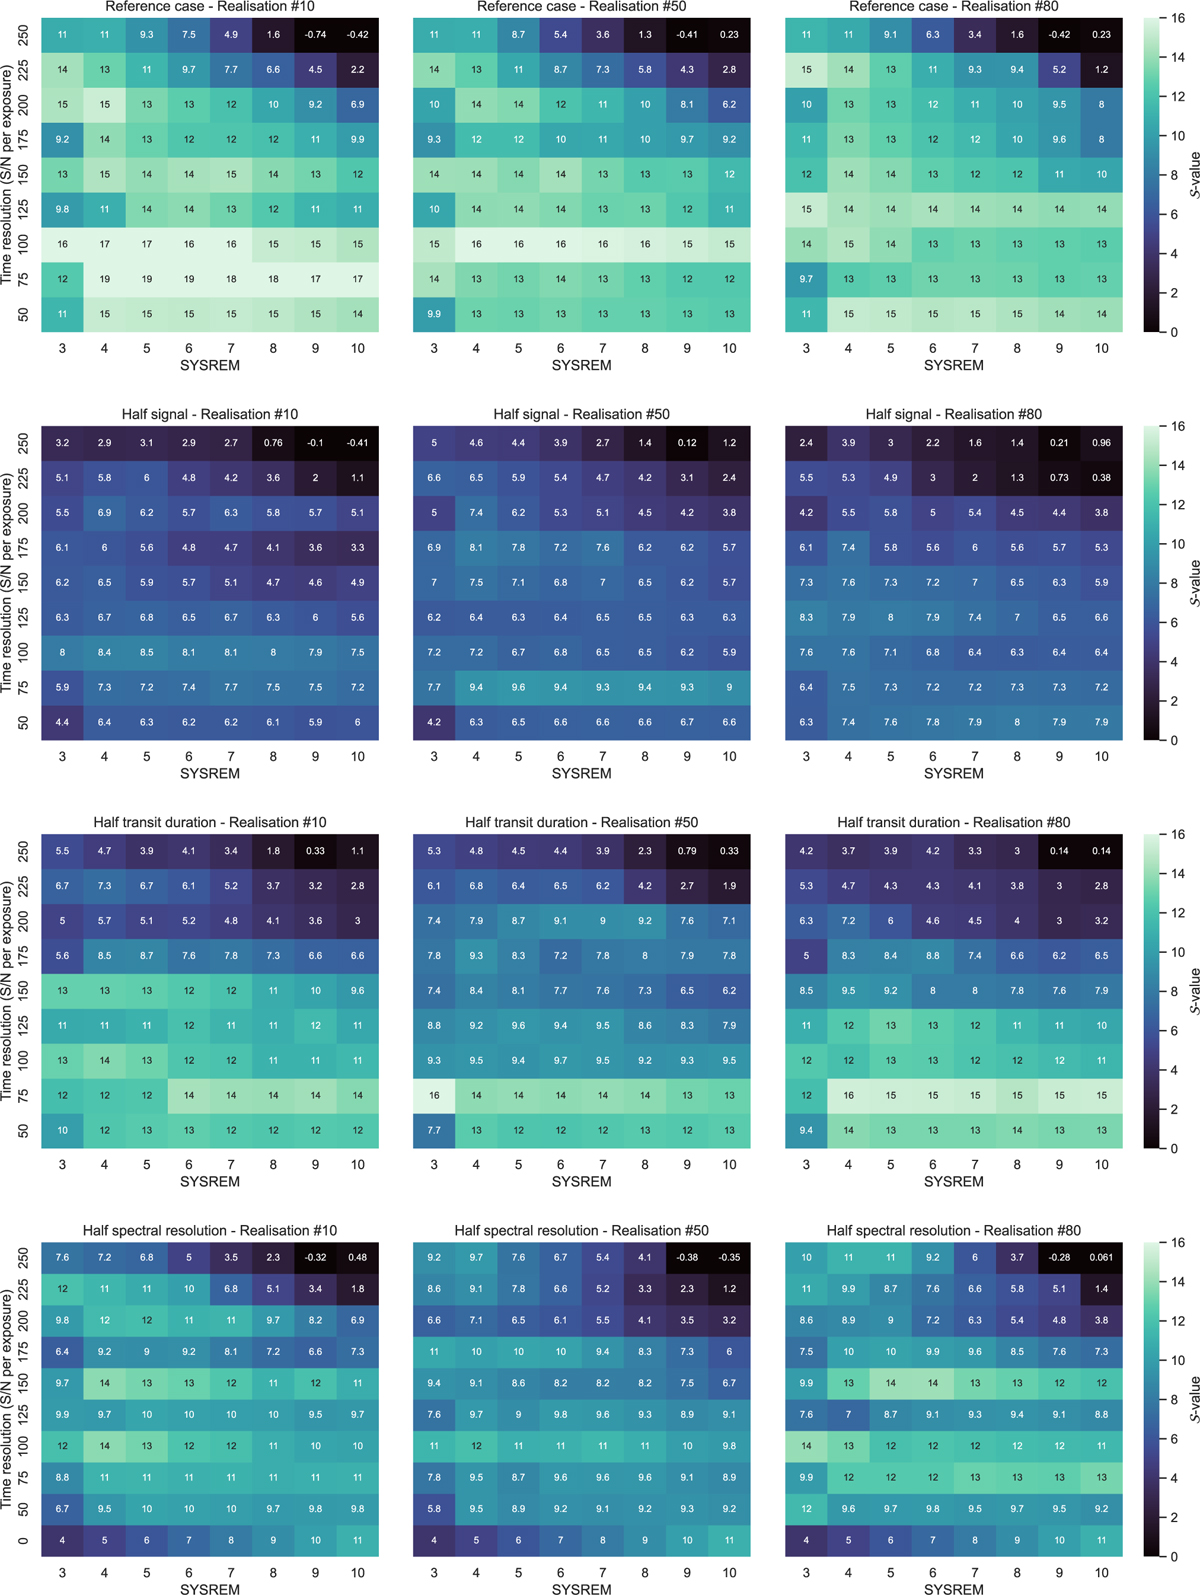
How the cross-correlation detection strength, 𝒮, varies across time resolution and SYSREM iterations for individual realisations of the four hypothetical cases. Each row represents (i) the reference case, (ii) the case of the halved planetary signal, (iii) the case of the halved transit duration, and (iv) the case of the halved spectral resolution, following the same format and parameters as in Fig. 5. Note that some values are beyond the colour bar’s scale, which has been locked to facilitate comparison to Fig. 5.
Current usage metrics show cumulative count of Article Views (full-text article views including HTML views, PDF and ePub downloads, according to the available data) and Abstracts Views on Vision4Press platform.
Data correspond to usage on the plateform after 2015. The current usage metrics is available 48-96 hours after online publication and is updated daily on week days.
Initial download of the metrics may take a while.