Fig. 5
Download original image
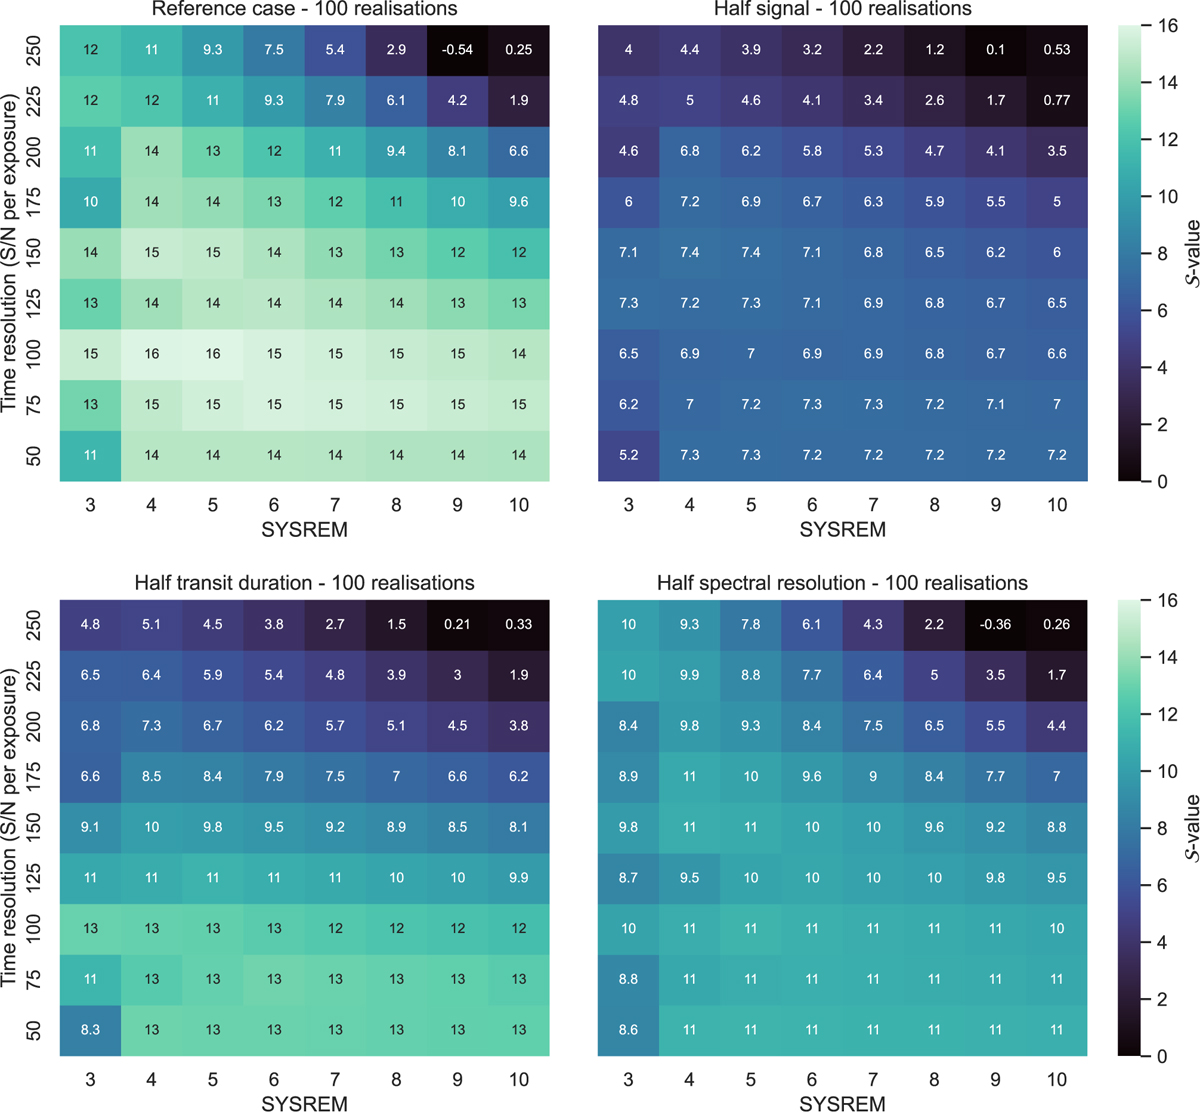
How the cross-correlation detection strength, 𝒮, varies across time resolution and SYSREM iterations for four hypothetical cases averaged across 100 realisations of the same observing night. (i) Top left: reference case of a hypothetical observation (R = 100 000) based on fiducial planet WASP-127 b. (ii) Top right: scenario where the reference case’s planetary signal strength is halved. (iii) Bottom left: scenario where the reference case's transit duration is halved. (iv) Bottom right: scenario where the reference case is observed with half the spectral resolution (R = 50 000). In these plots, a large number of short exposures corresponds to a lower S/Nexp (bottom of vertical axis) and a small number of long exposures corresponds to a higher S/Nexp (top of vertical axis).
Current usage metrics show cumulative count of Article Views (full-text article views including HTML views, PDF and ePub downloads, according to the available data) and Abstracts Views on Vision4Press platform.
Data correspond to usage on the plateform after 2015. The current usage metrics is available 48-96 hours after online publication and is updated daily on week days.
Initial download of the metrics may take a while.