Fig. 3
Download original image
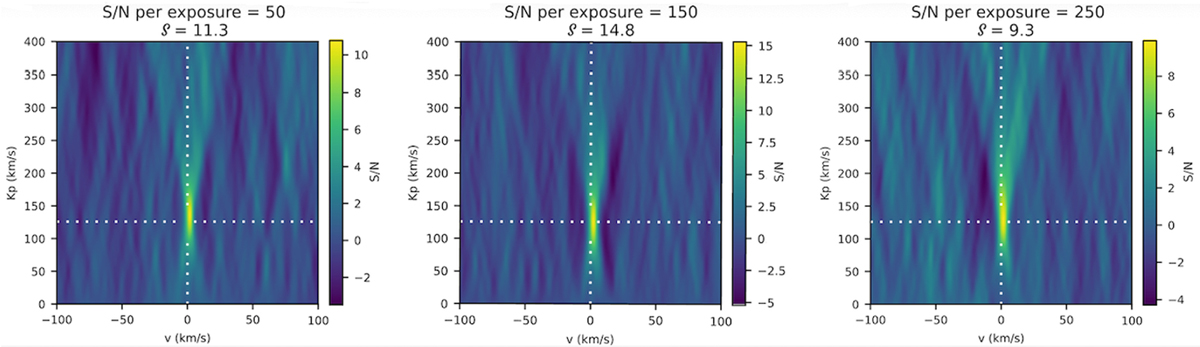
Example of three Kp − υsys detection maps for different time resolutions (‘high’ resolution for S/Nexp = 50, ‘medium’ for S/Nexp = 150, and ‘low’ for S/Nexp = 250) for the WASP-127 b case at SYSREM = 5. For each detection map, its respective measure of detection strength S is cited (see Sect. 3.3 for definition) with a higher 𝒮-value implying a stronger cross-correlation detection.
Current usage metrics show cumulative count of Article Views (full-text article views including HTML views, PDF and ePub downloads, according to the available data) and Abstracts Views on Vision4Press platform.
Data correspond to usage on the plateform after 2015. The current usage metrics is available 48-96 hours after online publication and is updated daily on week days.
Initial download of the metrics may take a while.