Fig. 2
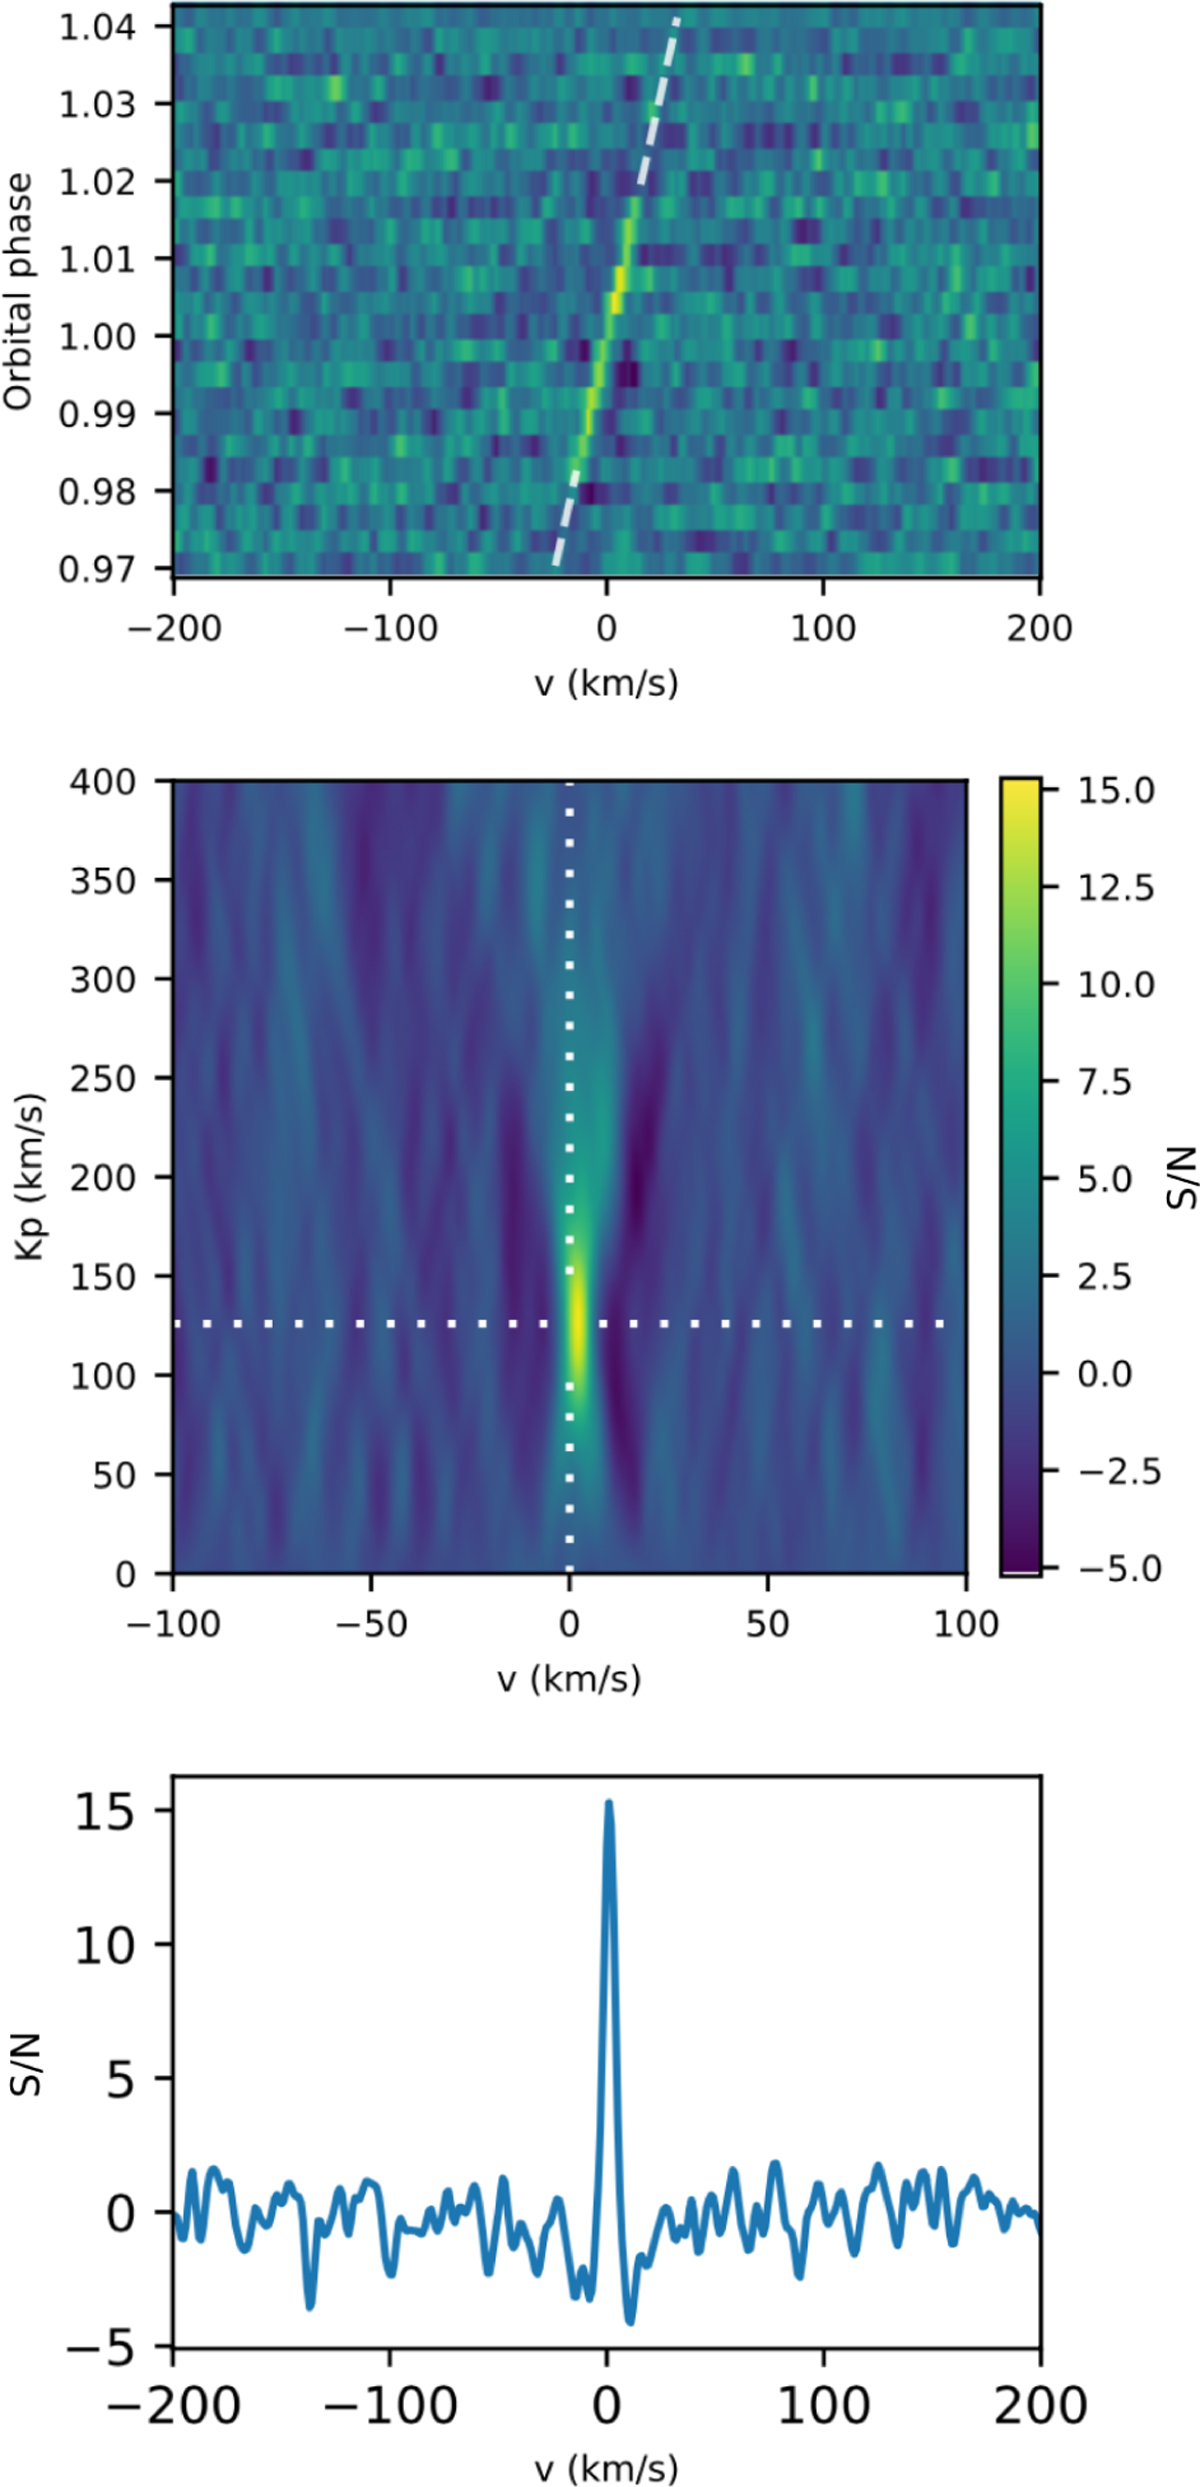
Download original image
Examples of data plots at three different points in the analysis. (a) Top panel: exposures are stacked along the vertical axis in time (where orbital phase ϕ = 1.0 is the middle of the primary eclipse). The dotted white lines indicate before and after the transit. (b) Middle panel: Kp − υsys detection map, where all values have been shifted into the planetary rest frame. The white dotted lines indicate rest frame system velocity (υsys = 0 km s−1) and the semi-amplitude of the radial velocity of the planet (Kp = 126 km s−1). (c) Bottom panel: example of what the cross-correlation function looks like at Kp = 126 km s−1, i.e. at the horizontal white line from (b).
Current usage metrics show cumulative count of Article Views (full-text article views including HTML views, PDF and ePub downloads, according to the available data) and Abstracts Views on Vision4Press platform.
Data correspond to usage on the plateform after 2015. The current usage metrics is available 48-96 hours after online publication and is updated daily on week days.
Initial download of the metrics may take a while.