Fig. 1

Download original image
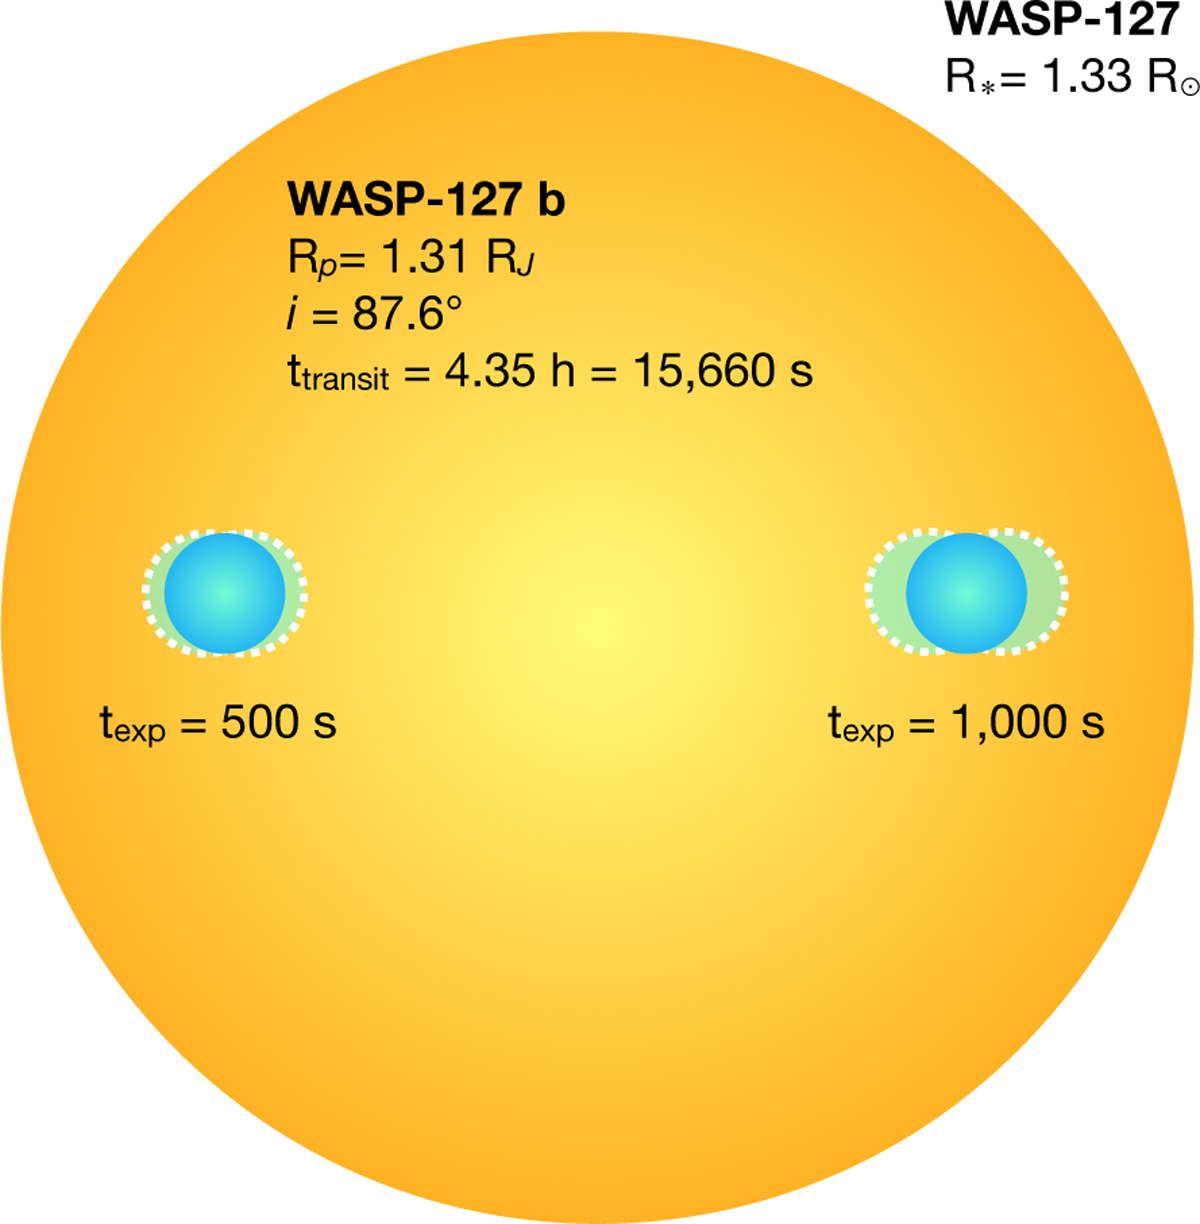
Schematic demonstrating how the smearing effect arises due to increased exposure length. Using an illustration of exoplanet WASP-127 b and its host star (to scale) as an example, consider the target’s transit time ttransit = 4.35 h = 15 660 s. A shorter exposure time of texp = 500 s (left) covers approx. 3% of the total transit time, versus a longer exposure time of texp = 1000 s (right) which covers approx. 6%. In this schematic, the location of the planet at the beginning and end of an exposure of length texp is shown by the shaded, dotted regions. The relative distance between these regions illustrates how much the target moves across a single exposure of the given time. This movement is greater for the longer exposure and thus will give rise to a larger smearing effect.
Current usage metrics show cumulative count of Article Views (full-text article views including HTML views, PDF and ePub downloads, according to the available data) and Abstracts Views on Vision4Press platform.
Data correspond to usage on the plateform after 2015. The current usage metrics is available 48-96 hours after online publication and is updated daily on week days.
Initial download of the metrics may take a while.


